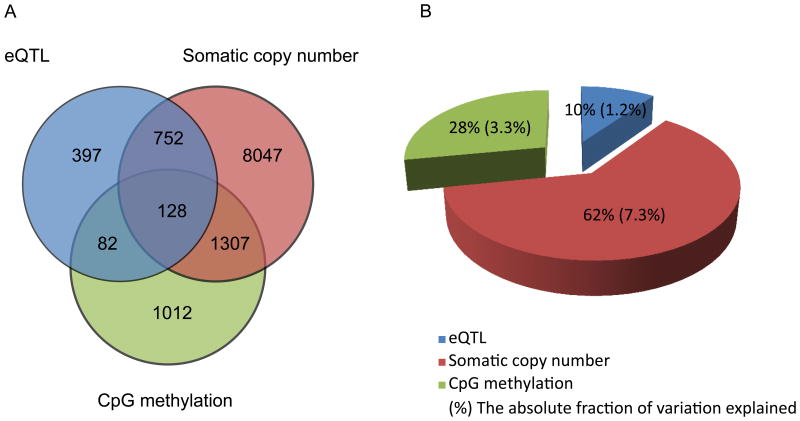
Figure 1.
Effects of three determinants on gene expression in ER-positive breast cancer:cis-acting SNP loci, somatic copy number and CpG methylation. (a) Venn diagram shows the number of genes that are under regulation of one or multiple factors. (b) Pie chart shows the relative and absolute fraction of variance of gene expression explained by three factors. Please see also Figure S1, Figure S2, Table S1, Table S2, Table S3, Table S5.

