
Figure 4.
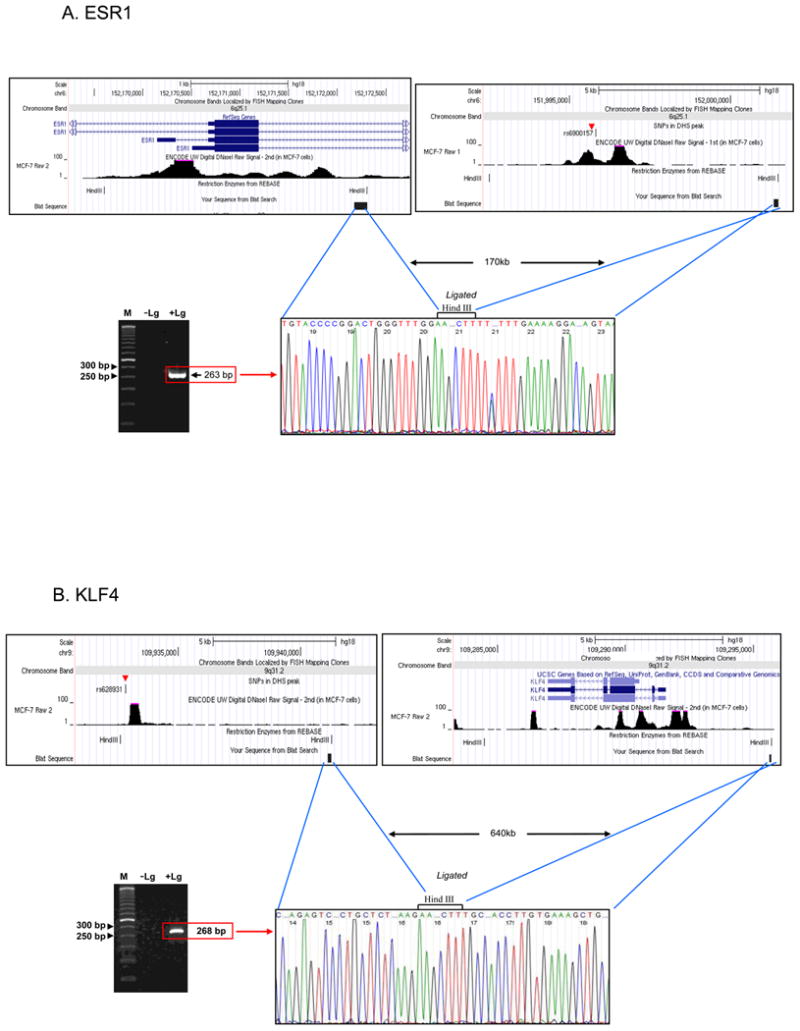
Chromosome conformation capture (3C) demonstrates physical interactions between the 6q25 risk locus and the ESR1 promoter and the 9q21 risk locus and the KLF4 promoter. (A) The top panel shows screenshots of the restriction fragments used for the 6q25/ESR1 interaction. These fragments are separated by approximately 170 kb. The lower left panel shows the gel image of the ligation band. The 263 base pair band is visualized only in the sample with ligase (+Lg) and no band is seen in the negative control sample without ligase (-Lg). The lower right panel demonstrates sequence verification of the +Lg band, confirming this interaction. (B) The 9q21 risk locus and KLF4 physically interact over a distance of 640 kb. Please see also Figure 3, Table 1.