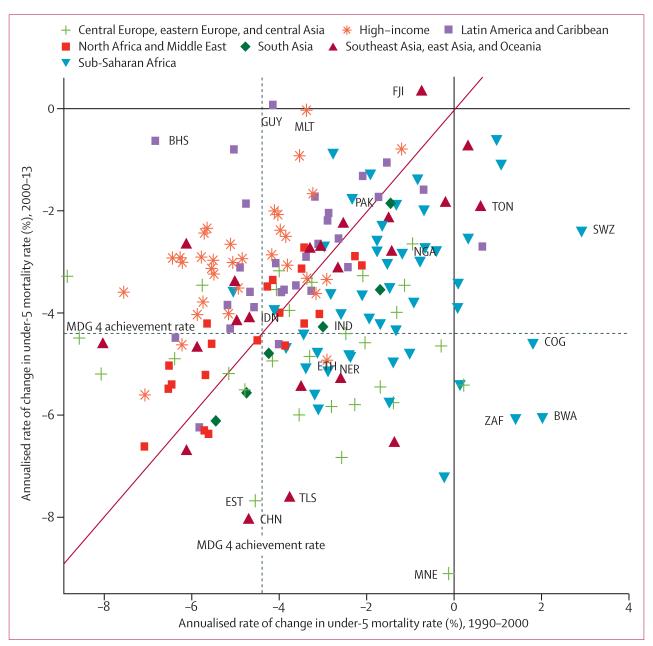
Figure 3. Global annualised rate of change in under-5 mortality rate (%) from 1990–2000, and 2000–13.
Solid line shows the equivalence line between the two periods. Dashed lines show the Millenium Development Goal 4 target rate of 4·4% per year. We excluded North Korea from the figure because of substantially higher rates of change that distort the scales in the figure.CHN=China. EST=Estonia. IDN=Indonesia. GUY=Guyana. ETH=Ethiopia. TLS=Timor-Leste. IND=India. NER=Niger. PAK=Pakistan. NGA=Nigeria. MNE=Montenegro. ZAF=South Africa. COG=Congo. TON=Tonga. SWZ =Swaziland. BWA=Botswana. BHS=The Bahamas. MLT=Malta. FJI=Fiji.

