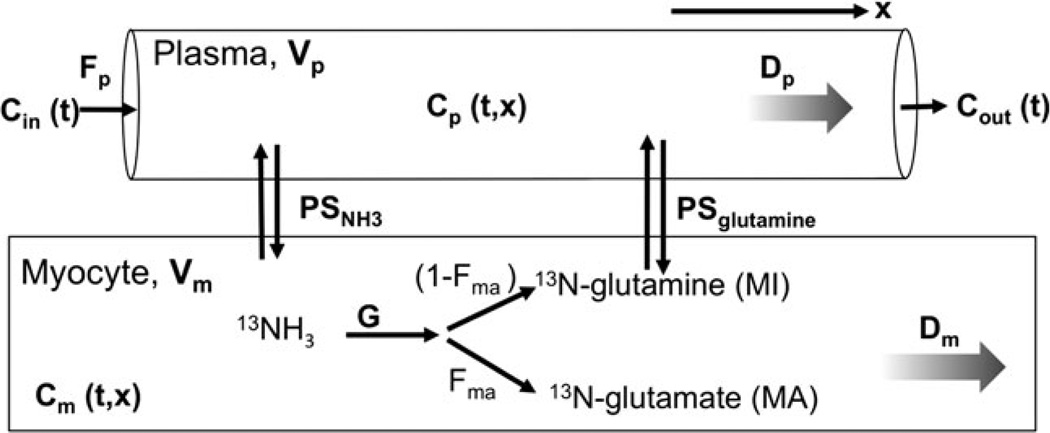
Figure 2.
Graphical representation of the major components of the axially distributed model. The plasma and myocyte regions contain spatially varying concentrations of N13 species with variation defined by dispersion coefficients Dp and Dm, respectively. Each region has a volume of distribution (V).

