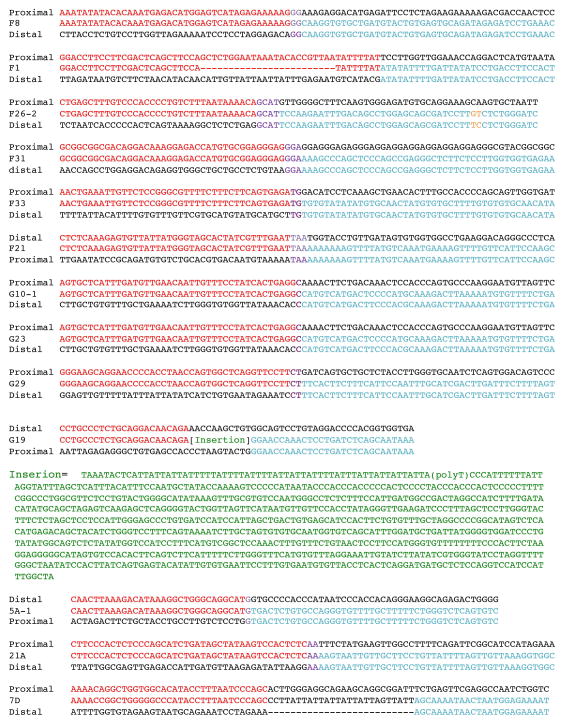
Figure 3. Breakpoint junction sequences characterized.
The breakpoint sequences are aligned to reference sequences at the distal and proximal ends of the rearrangement. The red to blue color transition indicates the precise locus of the breakpoint junction. Microhomology is highlighted in purple. Seven breakpoints (F8, F26-2, F31, F33, F21, G29, and 21A) showed microhomology of 2–4 base pairs. Three breakpoints (G10-1, G23, and 5A-1) had one base pair microhomology. Two samples, F1 and G19, had templated insertions at the breakpoints. The inserted sequence in G19, highlighted in green, was likely derived from part of an L1-LINE element. The deletion in 7D had short novel sequence inserted at the breakpoint.

