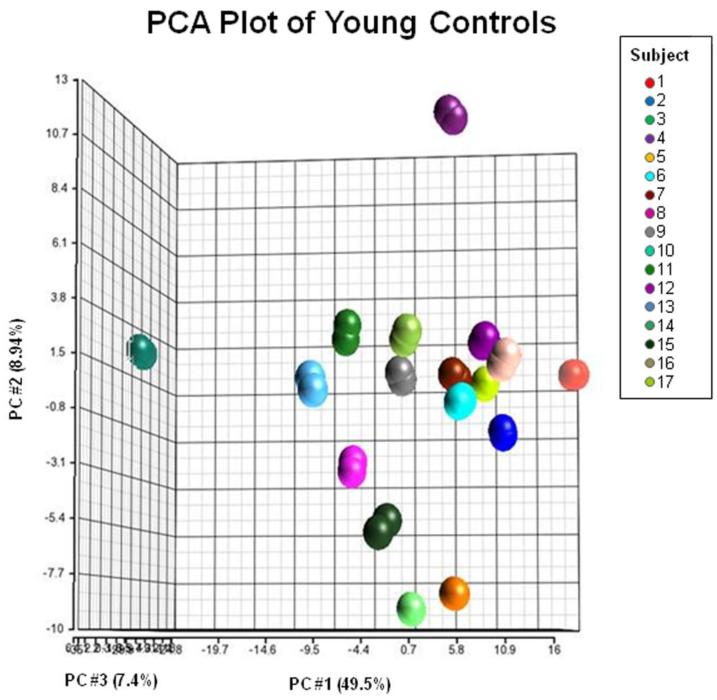
Fig. 3.
PCA results of the test-retest analysis using 17 healthy subjects, scanned twice. The data are plotted against the first three principal components, maximizing the separation of the data. There are two data points for each subject indicated. Colors correspond to different subjects. Axes represent principal components that account for the most variability between the 34 data points. Each principal component is a linear combination of the 254 parcels.

