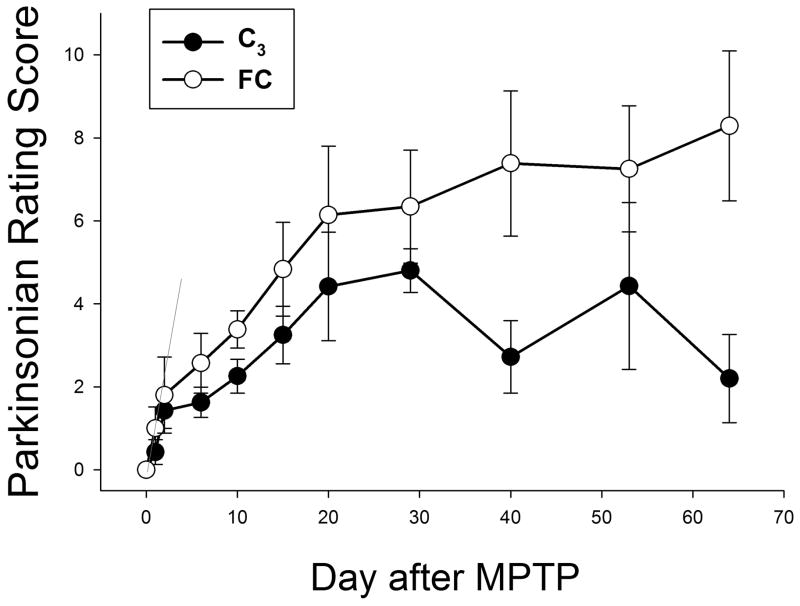
Figure 3. Dynamic functional assessment of Parkinson symptoms for C3-treated and control animals.
Animals were rated using an 18-point system which assesses the severity of parkinsonian symptoms (0= no symptoms; 18= most severely affected). Data are the mean and standard deviation of scores for all animals in each arm. Note the similarity of scores shortly after MPTP treatment, but prior to starting infusion of C3 or placebo, and the progressively different scores attained with longer infusions of C3. Scores for the two groups of animals diverged significantly beginning 30 days after the start of C3 infusion (p=0.026 by Mann-Whitney-Wilcoxon). Filled circles, C3-treated animals; open circles, control animals.

