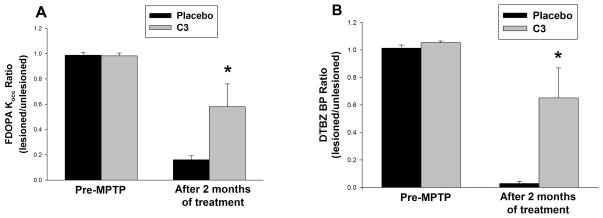
Figure 7. Summary of PET measures after completion of C3 or placebo infusion.
Quantification of (A) FD Kocc and (B) DTBZ BP at the end of the study. Data are the mean ± SEM of the nigral tracer uptake before MPTP, and at the end of the 2-month drug or placebo infusion. There was significant preservation of uptake for both tracers (FP Kocc p=0.038; DTBZ p=0.02) in the C3-treated group by repeated measures ANOVA, with Tukey’s post-hoc test. C3, n = 8; controls, n = 7.

