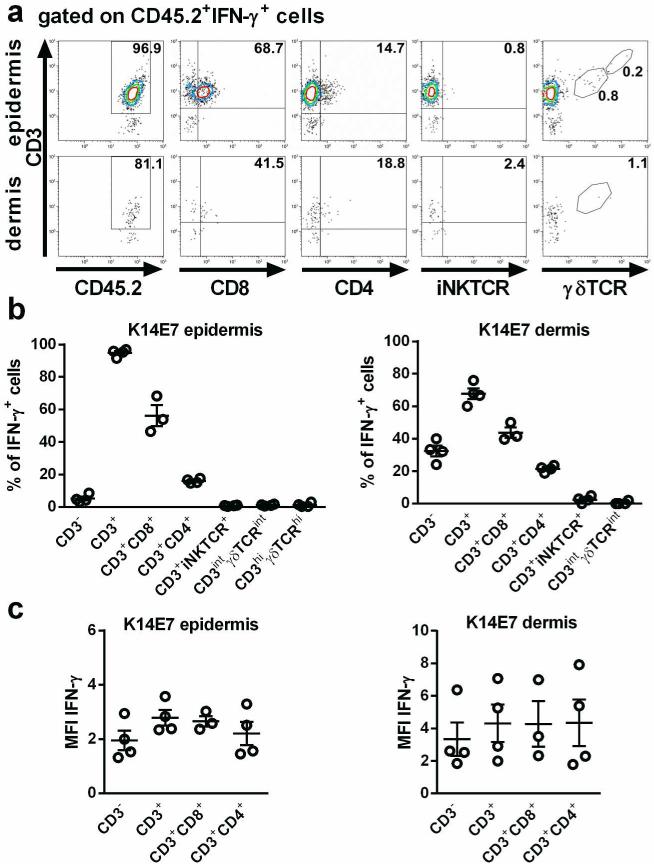
Figure 2. The majority of IFN-γ producing cells in K14E7 skin are CD8+ and CD4+ T cells.
Flow cytometric analysis of cells isolated from dermis and epidermis of K14E7 mice, stimulated with PMA and ionomycin. a,b Percentage of CD3+, CD3+CD8+ and CD3+CD4+ T cells, iNKT cells and γδ T cells of CD45+IFN-γ+ cells. Plots are representative of 4 independent experiments (2 mice per experiment), whose results are summarized in B. c Mean fluorescence intensity of IFN-γ-producing cell subsets from 4 independent experiments. Bars indicate means±SEM of 4 independent experiments.

