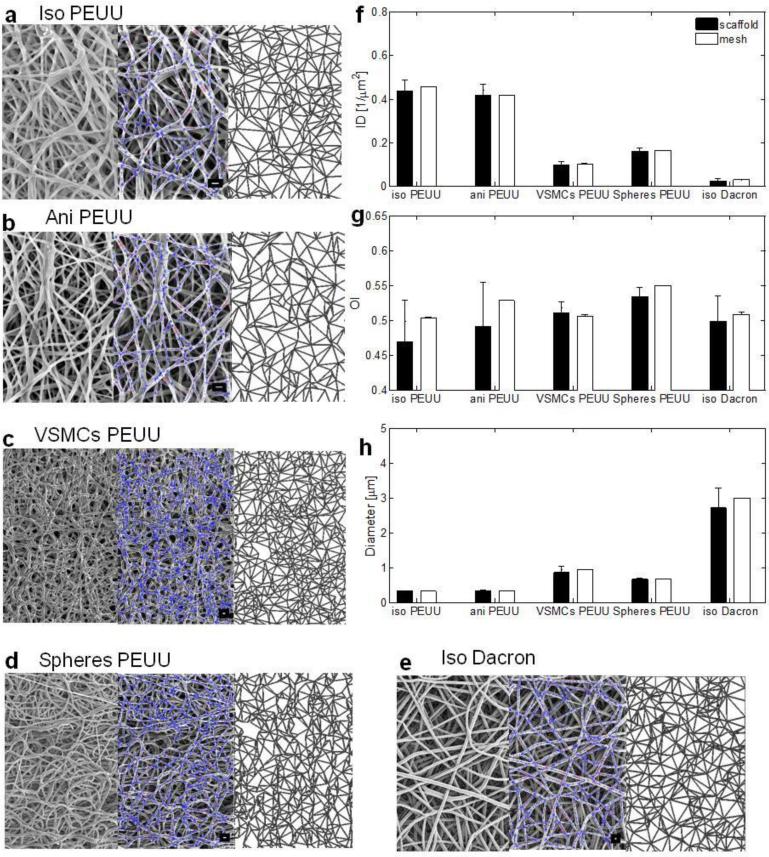
Figure 2. Real and simulated materials topologies characterization and comparison.
a-e, from left to right qualitative comparison: original material SEM micrograph (left), image analysis with overlaid detected fiber network (center), corresponding simulated topology (right). a PEUU isotropic, b PEUU anisotropic, c VSMCs integrated PEUU, d polystyrene integrated PEUU, e isotropic Dacron (additional details on supplementary figures 8-12), scale bar = 1 μm. Quantitative comparison of micro architectural features characterizing the real and simulated fiber networks: f intersection density (ID) defined as the number of fiber overlaps/μm2, g orientation index (OI) metric for fiber alignment (0.5 for purely isotropic network, 1 for a set of parallel fibers), h fiber diameter (D) defined as the mean of the fiber network diameter distribution (μm).Additional materials have been characterized and included in this classification (supplementary figure 7, data were presented as mean ± st.d.) n≥5 images/material were utilized for the image analysis and n≥5 meshes/material were generated and quantified.

