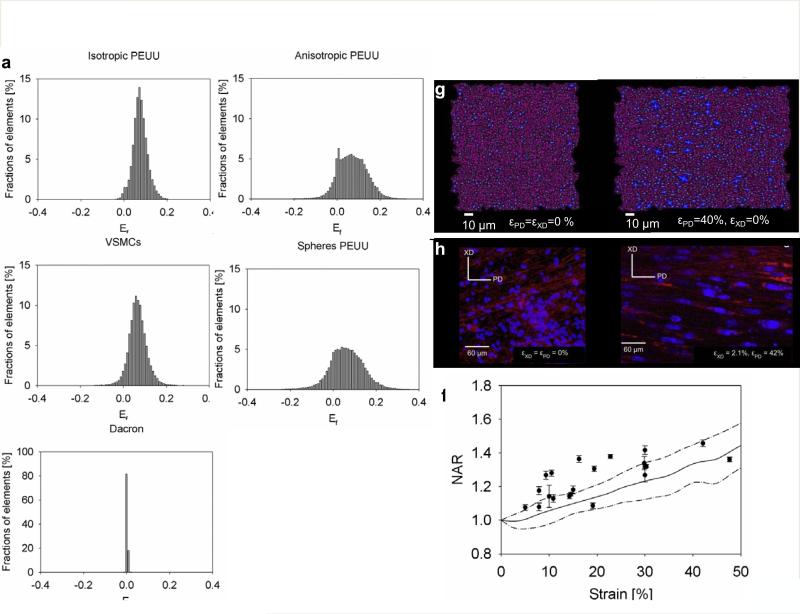
Figure 7. Meso scale level validation and prediction.
a, e fiber E11 histograms for isotropic PEUU, anisotropic PEUU, VSMCs PEUU, microspheres PEUU, isotropic Dacron. In order to make comparable measurements, histograms were obtained at equi-stress of 200kPa. The width of the histograms increased with the level of anisotropy showing a higher fraction of fibers under compression (a, c isotropic materials vs. b, d anisotropic materials). As expected, higher stiffness reported for the Dacron induced tighter distribution of Ef. The ID had an impact on the peak in the Ef distribution, peak value increased with increasing ID, i.e., the denser the fiber network, the higher the Ef on a single fiber (a-d, Tab.1). Model prediction for NAR vs. strain are provided in (f-h), and compared quantitatively (f) and qualitatively (g-h) with the experimental data[19], inter fibers voids are represented in dark purple at εPD=εXD= 0% (starting configuration g-h left) and εPD= 40%, εXD= 0% (final stretched configuration g-h right) whereas the fibers are represented in magenta, figure h was readapted from[19].

