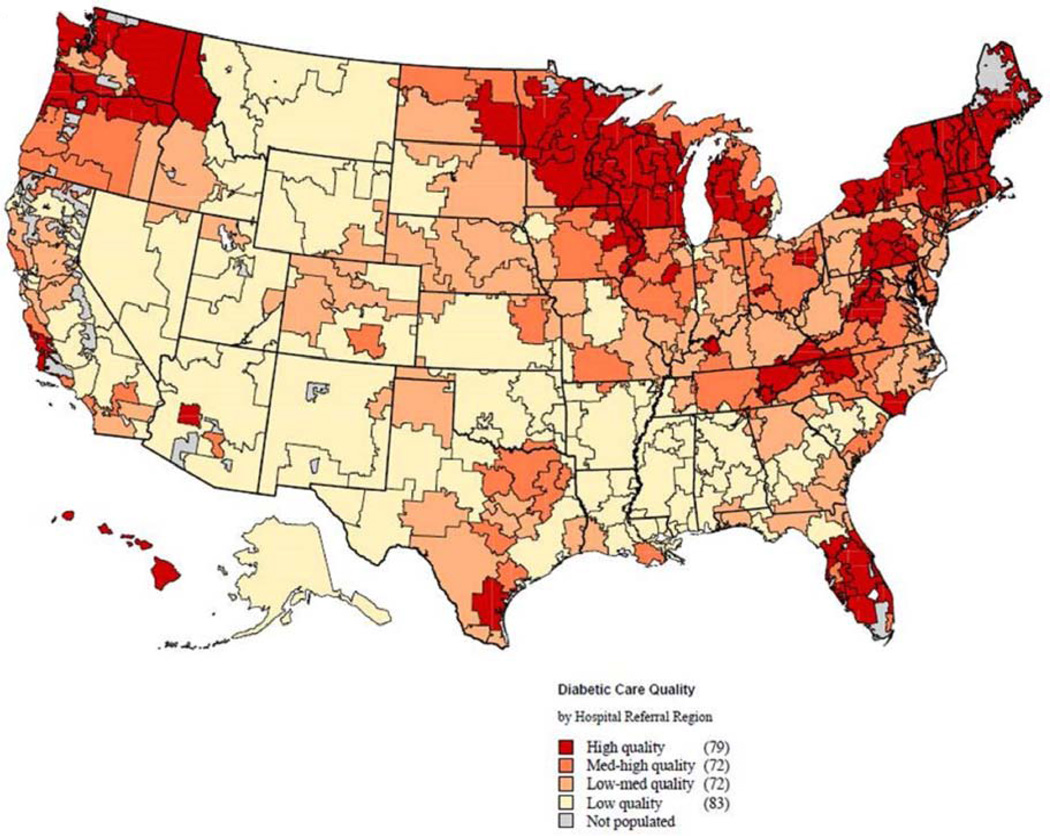
Figure 1.
Distribution of diabetic care quality across the U.S. population as indexed by quartiles of annual hemoglobin A1c and serum cholesterol testing rates among all hospital referral regions on the map. The dark red areas represent hospital referral regions within the quartile with the highest rates of annual testing (i.e. high-quality diabetic care), whereas the light areas are hospital referral regions with the lowest rates of annual testing (i.e. low-quality diabetic care).

