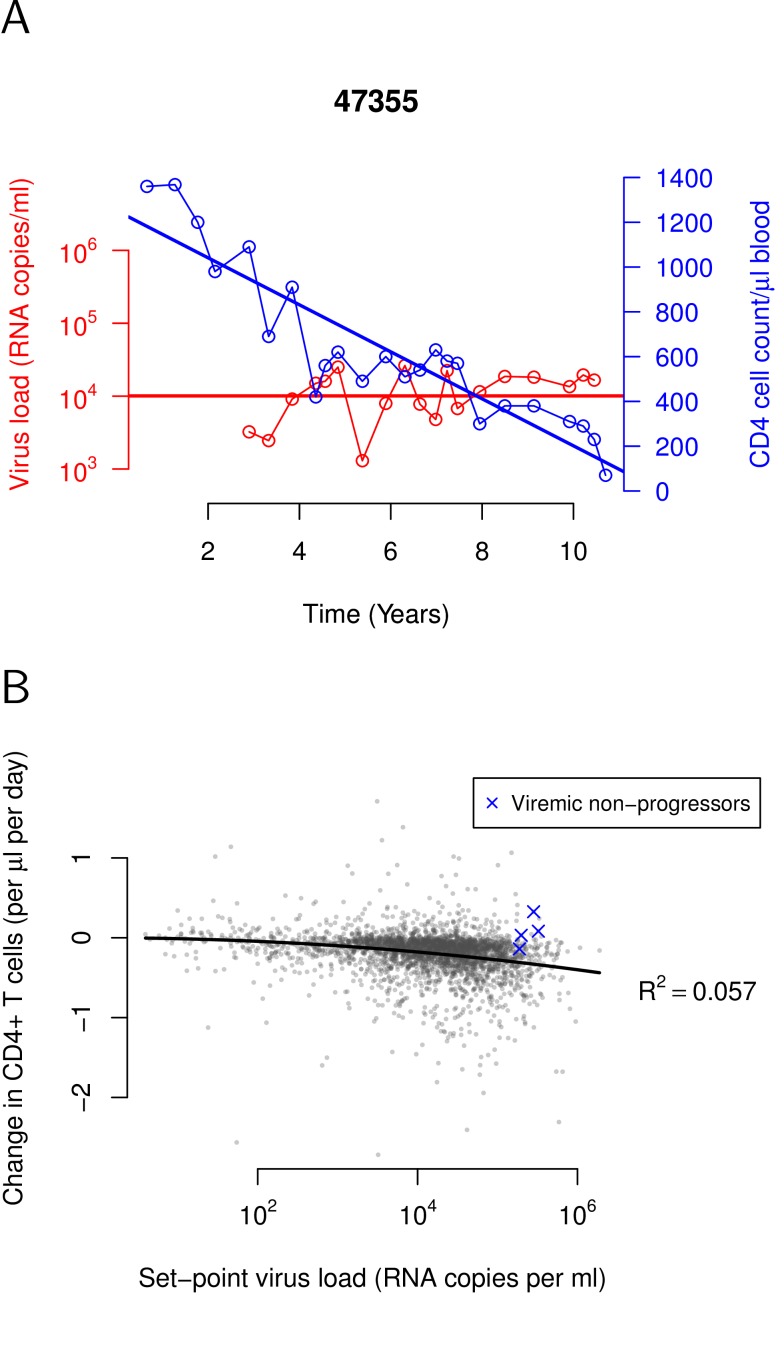
Figure 2. Relationship between CD4+ T-cell decline and set-point viral load in our study population.
(A) Calculation of the set-point viral load and CD4+ T-cell decline, illustrated for a single individual. The set-point viral load (red line) is calculated as the geometric mean of the viral load measurements (after primary infection and before treatment). The decline of CD4+ T cells is determined as the regression slope (blue line) of CD4+ T-cell counts against time. The CD4+ T-cell counts and virus load measurements of three randomly selected individuals are shown in Figure S1. (B) Nonlinear tolerance curve characterizing the relationship between CD4+ T-cell decline and set-point viral load in our study population (n = 3,036). The black line shows the quadratic regression line. Blue crosses indicate individuals that were identified as viremic nonprogressors in a previous study [26].

