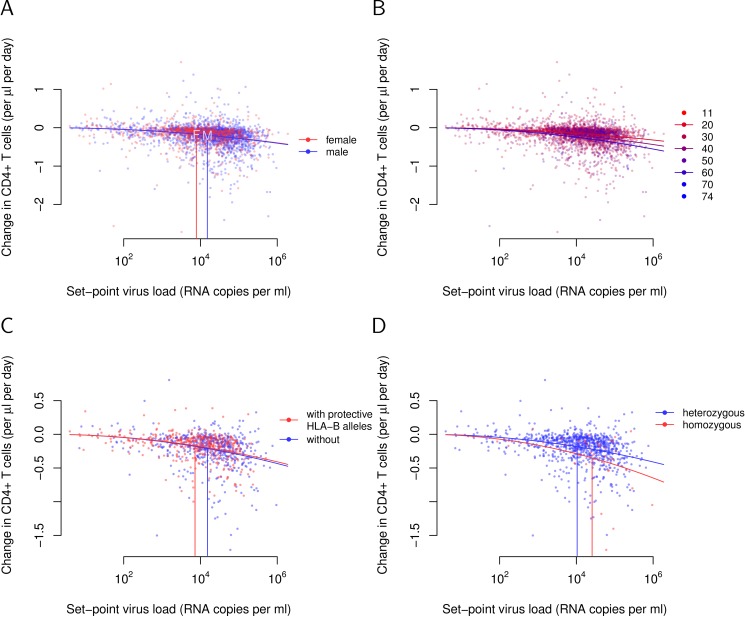
Figure 3. Investigating associations of tolerance with sex, age at infection, and HLA-B alleles.
(A) Tolerance does not differ significantly between sexes in a univariate analysis. (B) Young age at infection is strongly associated with tolerance. The data are plotted stratified by age. The younger, the redder. The three curves show the relationships between set-point viral load and CD4+ T-cell decline when infected at age 20, 40, and 60. (C) Classic protective HLA-B alleles induce pure resistance. The tolerance curves do not differ significantly for individuals with (red, n = 416) and without (blue, n = 507) protective HLA-B alleles. Protectiveness is defined according to the data presented in table 1 of [30] (see Materials and Methods). (D) HLA-B homozygosity is associated with tolerance. Homozygotes also have significantly higher set-point viral loads—that is, are more resistant than heterozygotes.

