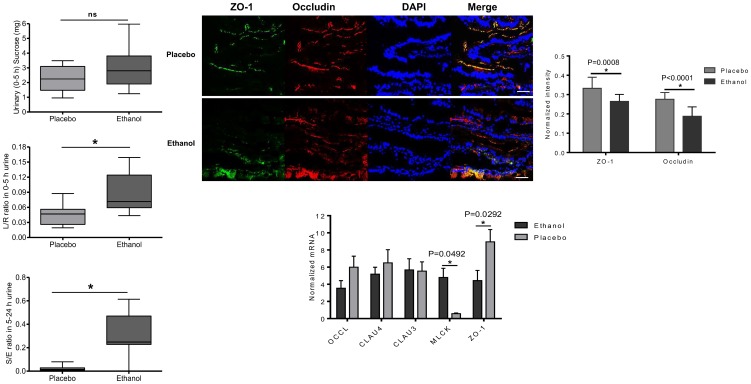
Figure 2. Effects of placebo and single dose of 20 g of ethanol on intestinal permeability, TJs protein and gene expression in the duodenum.
[A] Effects on gastroduodenal permeability (sucrose, 0–5 h urinary recovery). Data presented as boxplots displaying minimum, maximum, and the 25th, 50th and 75th percentiles (n = 12); P>0.05 vs. placebo. [B] Effects on small intestinal permeability (lactulose/rhamnose; L/R ratio, 0–5 h urine). Data presented as boxplots displaying minimum, maximum, and the 25th, 50th and 75th percentiles (n = 12); *P<0.01 vs. placebo. [C] Effects on large intestinal permeability (sucralose/erythritol; S/E ratio, 5–24 h urine). Data presented as boxplots displaying minimum, maximum, and the 25th, 50th and 75th percentiles (n = 11); *P<0.01 vs. placebo. [D] Representative images of immune-localization of ZO-1 (green), occludin (red), and nuclei (blue) at a 400x magnification are shown. Scale bar represents 10 µm. [E] Normalized intensity of immunofluorescent-labelled ZO-1 and occludin in duodenal mucosa. Z-stack images were at 40× objective power. Data are mean ± SD (n = 12). *P<0.05 for ZO-1, # P<0.05 for occludin. [F] Normalized mRNAs expression of occludin (occl), claudin 4 (clau4), and claudin 3 (clau3), MLCK and ZO-1 in duodenal biopsy specimens determined by qPCR. Each bar represents the mean± SD; *P<0.05 comparing ethanol with placebo.

