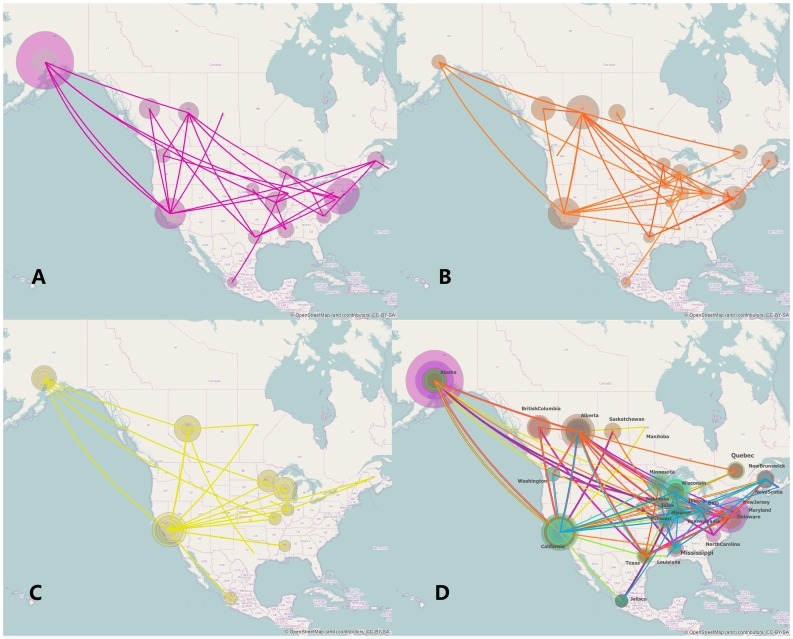
Figure 4. Spatial diffusion of AIV segments of the Mexico outbreak AIV.
The first three panels represent three segments separately (A: HA, B: NA, C: PB2) and D represents the spatial transmission of all 8 segments jointly. The plotted lines represent the branches of the MCC trees for different segments, distinguished by color; the size of each circle represents the number of lineages with that location state. The map source for this figure was OpenStreetMap (http://www.openstreetmap.org/). The spatial diffusions of other five segments (PB1, PA NP, M and NS) on the map are shown in Figure S9.

