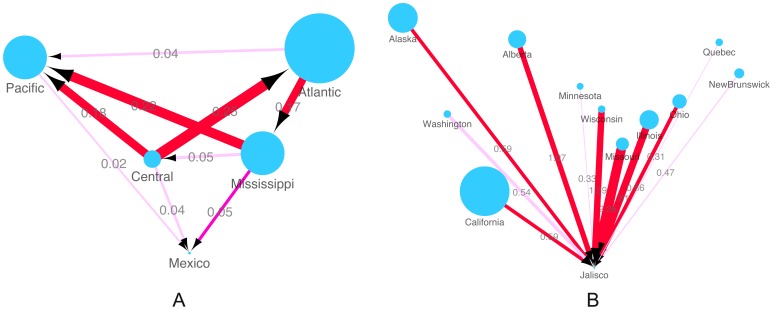
Figure 5. Inferred phylogeographic transmission networks of Mexican outbreak AIV.
A: Flyway. AIV transmission among 4 N. American flyways with links to the Mexican outbreak strains. Arrows show the direction of transmission between two flyways; arrow weight and the number above each arrow indicates the per capita transmission rate. Node size reflects the number of AIV for each flyway (Table S6). B: Location. AIV transmission among states/provinces in North America and Jalisco (the Mexican state where the outbreak strains were isolated). Arrows show the direction of transmission between the two states; the arrow weight and the number above each arrow indicates the per capita transmission rate. Node size reflects the number of AIV for each flyway (Table S5).

