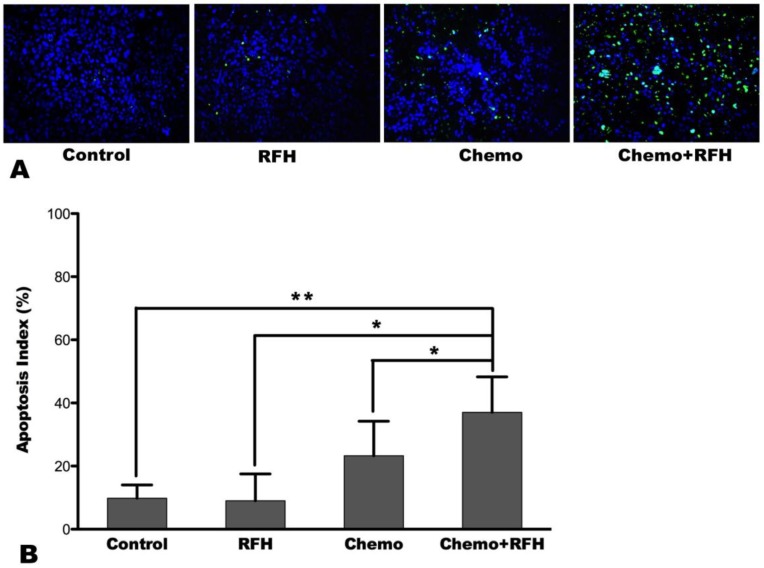
Figure 6.
(A) Apoptosis assay demonstrates more apoptosis cells (green dots) in the combination therapy group (Chemo+RFH) than in other three groups, which is further confirmed by analysis of the apoptosis index, showing higher apoptosis index with combination treatment compared to other treatments (B) (*, p < 0.05; **, p < 0.01).

