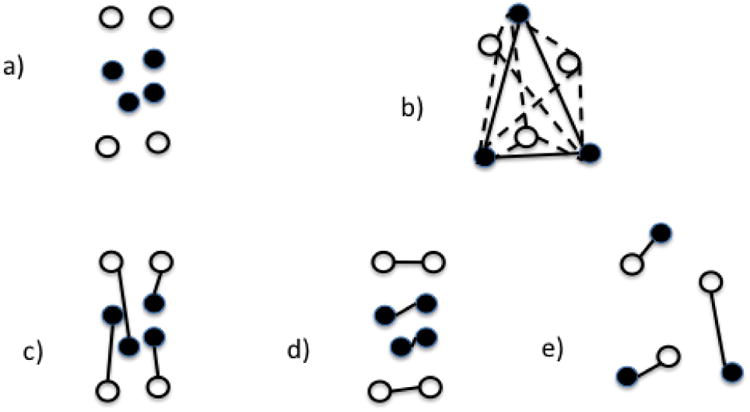
Figure 3.

Schematic for group statistics. Filled disks represent single networks from a group of empirical networks while unfilled disks represent single networks from a group of a matched random network model, such as ER networks. The distance between disks represents their Hamming distances. a) An example where the mean of the two groups are similar but the empirical networks have significantly less variation between networks. b) Another example: the average length of the solid lines is the self-span of the empirical networks while the average length of the dashed lines is the cross-span of the two groups. c) A matching between the two networks which is not minimal. d) The minimum matching between the two groups, showing a cross-match of 0, since there are no edges between the two groups. e) A minimal matching for the groups in part (b), showing a cross-match of 1, since all edges join networks from different groups.
