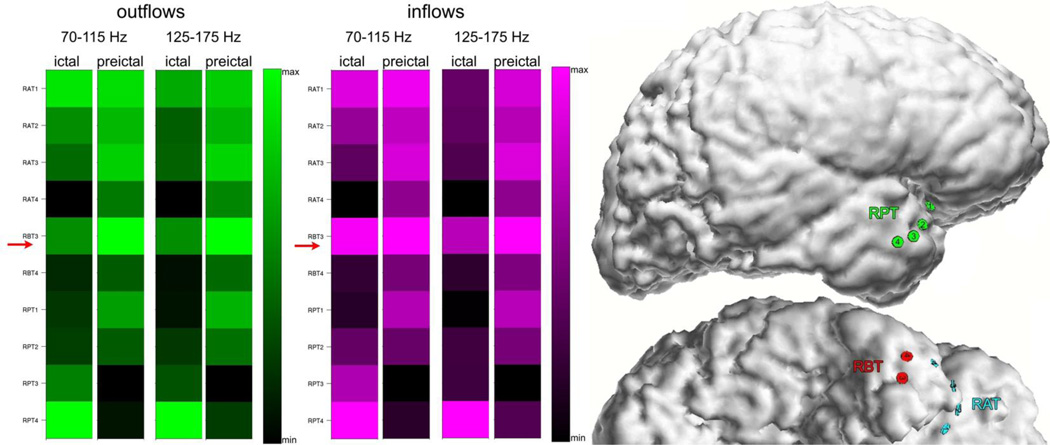
Fig. 5.
Averages of SdDTF for propagations between the site of ictal onset and all other recording sites, for two frequency ranges of 70–115 Hz and 125–175 Hz, during ictal and preictal periods for Patient #3. Color conventions and organization of the figure are as in Fig. 4. The right panel shows a right lateral and basal view of the brain with electrode positions depicted.

