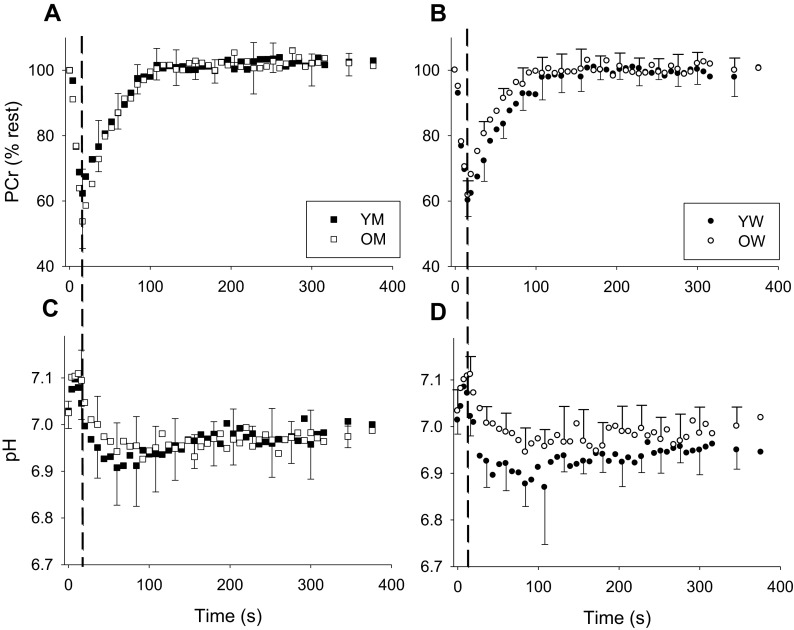
Fig. 1.
Metabolic changes in tibialis anterior PCr (a, b) and pH (c, d) during contraction and recovery in young and older men (a, c) and women (b, d). PCr is expressed relative to resting values. The end of the 16-s contraction is indicated by the dashed vertical line on each plot. Following contraction, the recovery of PCr was well approximated by a monoexponential function in all groups (r 2 = 0.90 ± 0.06, 0.90 ± 0.04, 0.91 ± 0.03, and 0.87 ± 0.04 for YM, OM, YW, and OW, respectively). Error bars indicating SD are provided every 24 s during recovery, for clarity

