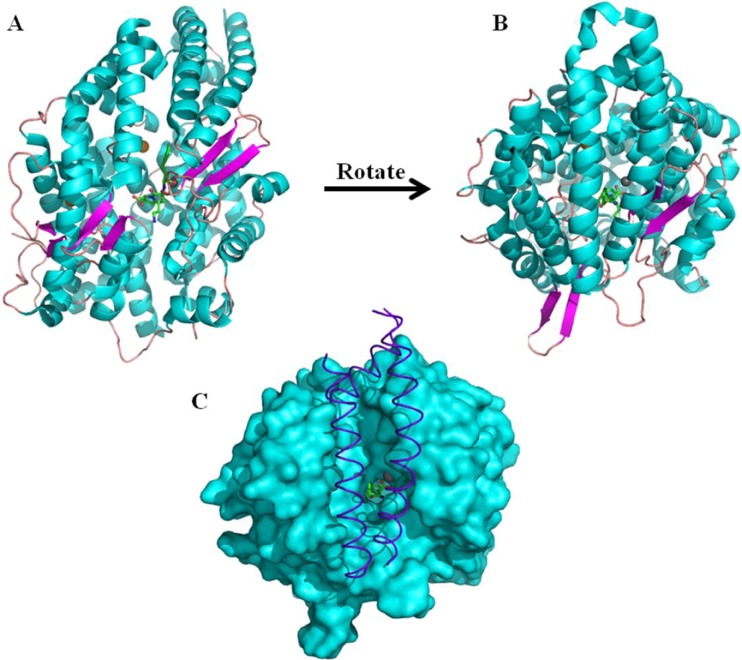
Fig. 2.
The structure of human tACE. (a) and (b) cartoon representation of the tACE structure with helices shown in cyan, β-strands in magenta and loops in pink. The catalytic zinc ion is shown as a grey sphere at the centre of the long substrate binding channel which effectively divides the molecule into two subdomains. Also visible in the active site is the inhibitor lisinopril and the two chloride ions shown as orange spheres. Three N-terminal helices form a “lid” over the substrate binding channel and this is shown more clearly by viewing the molecule from the angle used in (b). The role of the lid in capping the substrate binding channel is highlighted in (c), where the three N-terminal helices which form the lid are shown in purple with the rest of the molecule shown as a cyan surface representation. The lisinopril and zinc are shown bound in the active site. In (c) the molecule is viewed from the same angle as in (b)

