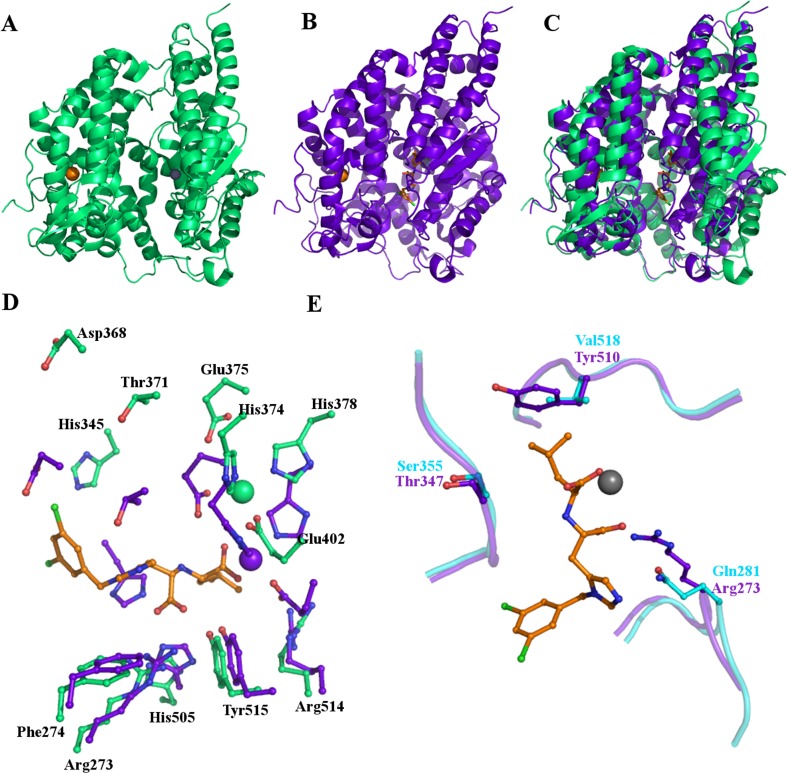
Fig. 6.
The structure of ACE2. (a) Cartoon representation of the overall structure of native ACE2 illustrating the position of the chloride and zinc ions and the deep cleft across the molecule. (b) The structure of ACE2 bound to the inhibitor MLN-4760 showing a significant conformational change occurring on inhibitor binding. This is highlighted in (c) where the inhibitor bound structure (purple) is superposed on the native structure (green). The two subdomains move relative to each other, closing in around the inhibitor. (d) Movement of active site residues on inhibitor binding. Stick representations in green of key residues in the native structure and their positions in the inhibitor bound structure, purple. The catalytic zinc ion also moves and its positions are also shown in green and purple. The inhibitor is shown as sticks with orange carbon atoms bound in the active site. (e) Some key differences between tACE (cyan) and ACE2 (purple) which restrict the size of the S1 binding pocket, probably restricting space such that ACE2 can only remove the terminal residue from the C-terminus of peptide substrates whilst ACE removes the C-terminal dipeptide

