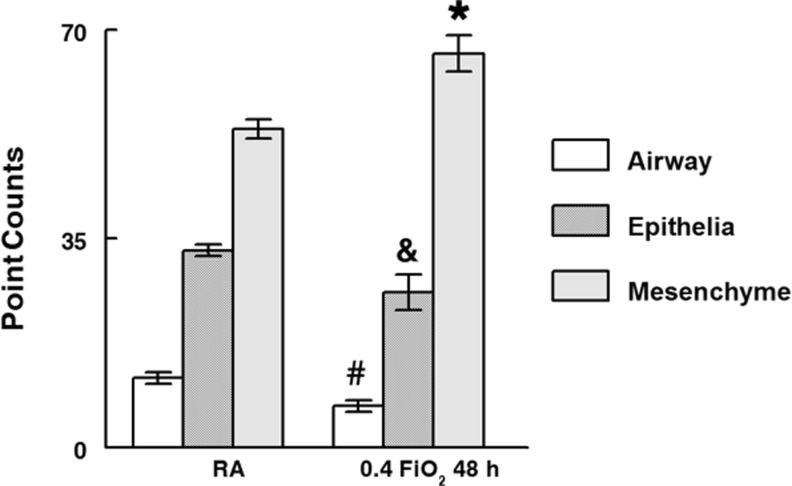
Fig. 5.
Morphometry (point counts) quantified lung regions affected by 0.4 FiO2. Compared to RA, O2-exposure significantly decreased airway space (40 %↓) and epithelial cell volume (7 %↓) but increased mesenchyme volume (13 %↑). #P = 0.003; &P = 0.04;*P = 0.002, O2 versus RA, Mean ± SEM, N ≥ 30 tissue sections each separated by at least 18 μm from ≥ 3 lungs/condition

