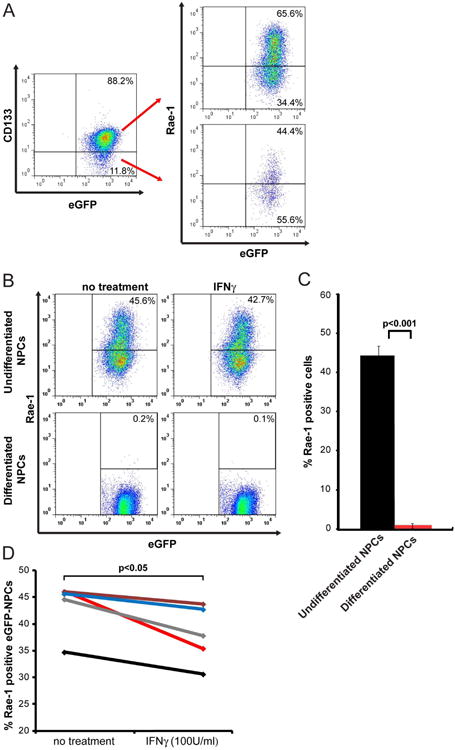
Figure 1. RAE-1 expression on cultured NPCs.

(A) Representative dot blot showing staining for the NPC marker CD133 and eGFP; 85.1±1.6 % of cultured eGFP-NPCs expressed CD133. Subsequent staining for RAE-1 on eGFP+CD133+ and eGFP+CD133- revealed 64.3±0.7% of dual-positive cells expressed RAE-1 while 48.3±2.0% of eGFP+CD133- cells expressed RAE-1. (B,C) Differentiated and undifferentiated cultured eGFP-NPCs were treated with IFN-γ (100 U/ml) for 24 hr and RAE-1 expression was determined by flow cytometry. (B) Representative flow analysis for RAE-1 expression on IFN-γ-treated or non-treated differentiated and undifferentiated eGFP-NPCs is shown. (C) Quantification of RAE-1 expression on differentiated and undifferentiated non-treated eGFP-NPCs. Data represents five independent experiments and data is shown as average±SEM; p<0.05. (D) Quantification of RAE-1 expression on non-treated and IFN-γ-treated undifferentiated eGFP-NPCs. Paired data from five independent experiments showing decreased RAE-1 expression following IFN-γ treatment. The average decrease from all experiments is 12.3±3.3% SEM; each line represents an individual experiment; p<0.05.
