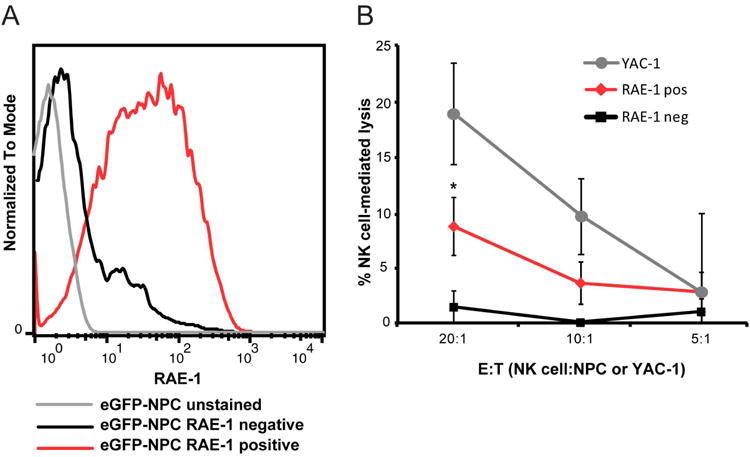
Figure 2. NK cell lysis of RAE-1+ NPCs.

(A) Representative histogram depicting RAE-1+ (red line) and RAE-1- (black line) eGFP-NPCs sorted by FACS. eGFP-NPCs stained with isotype control antibody are indicated by grey line. (B) RAE-1+ (red line) eGFP-NPCs, RAE-1- (black line) eGFP-NPCs, or YAC-1 (grey line) cells (control for NK cell lysis) were cultured with allogeneic NK cells in an LDH assay and the percentage of NK cell-mediated lysis at three different E:T ratios is shown. Data represent three independent experiments; *p<0.05, unpaired student's T test between RAE-1+ and RAE-1- eGFP-NPCs.
