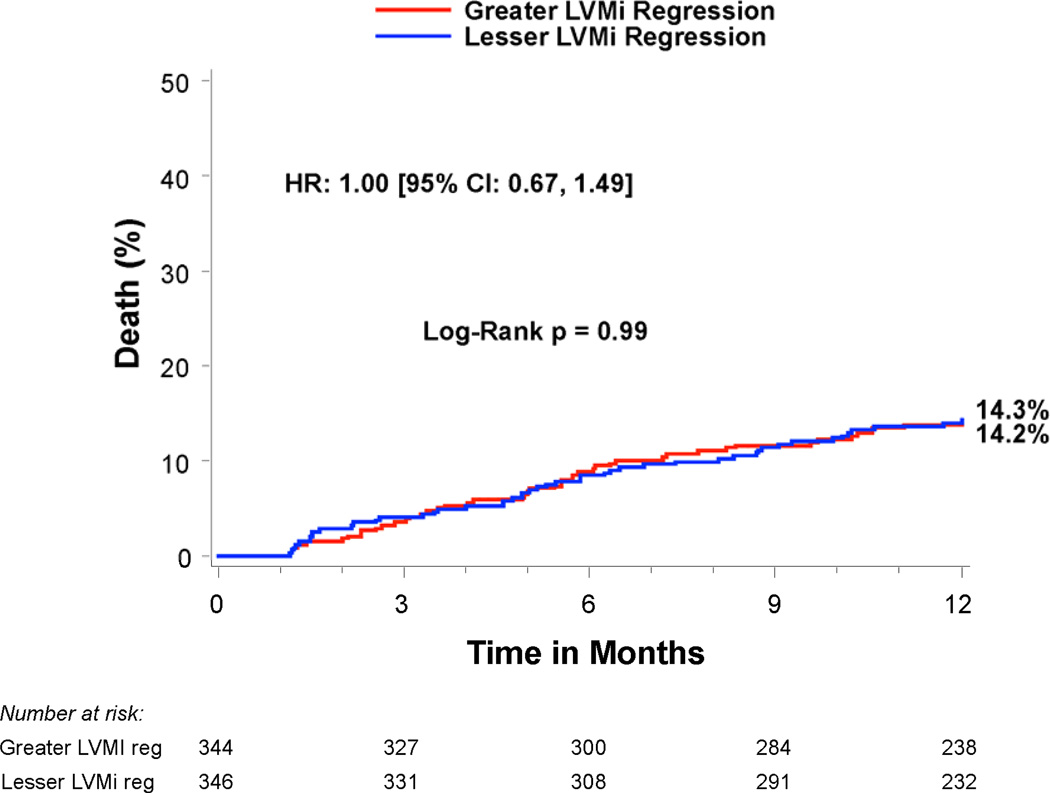
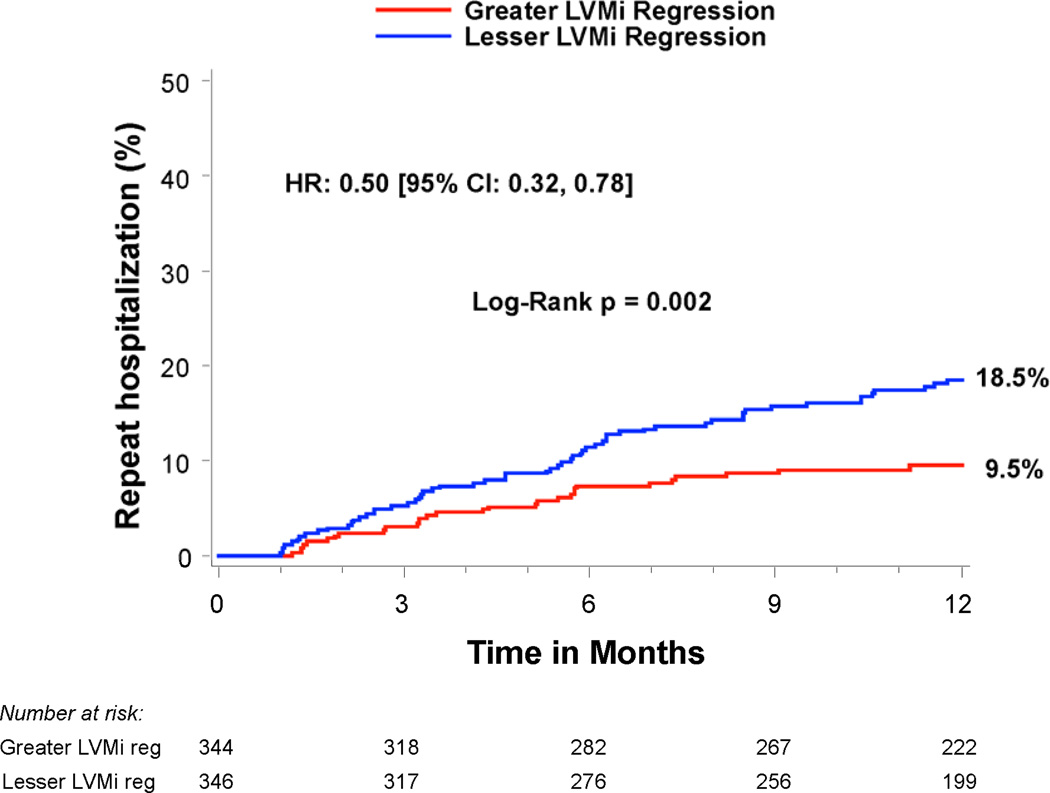
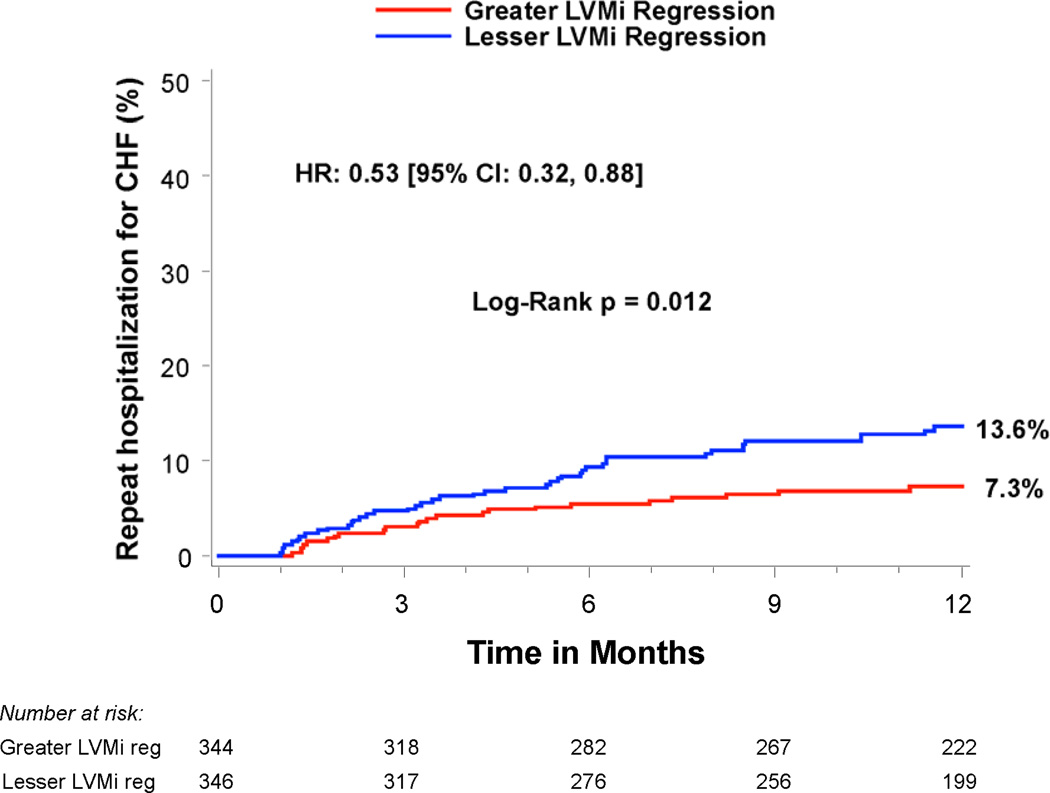
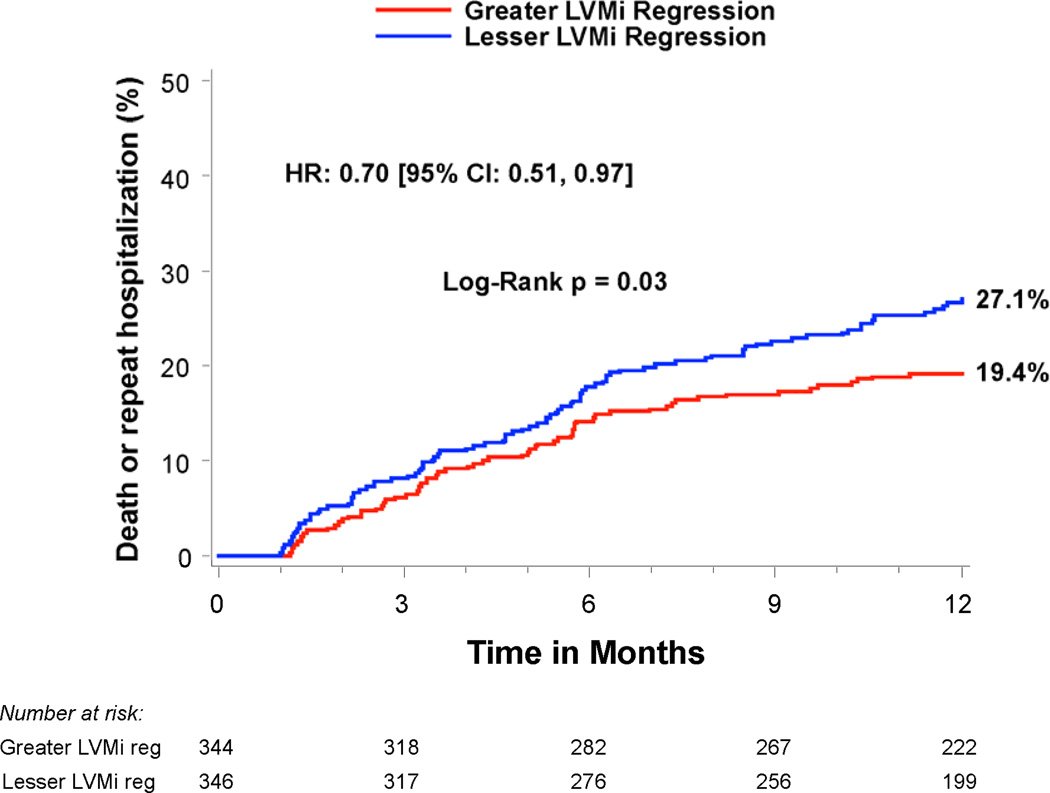
Figure 3. Time-to-event curves for death or repeat hospitalizations from 30 days to 1 year.
Time-to-event curves are shown from 30 days to 1 year for a) death (all-cause), b) repeat hospitalizations, c) repeat hospitalizations for heart failure, and d) death (all-cause) or repeat hospitalizations for patients with symptomatic aortic stenosis and severe left ventricular hypertrophy at high surgical risk receiving transcatheter aortic valve replacement (TAVR) in the PARTNER randomized trial or continued access registry. The curves compare patients with greater vs. lesser left ventricular mass index (LVMi) regression from baseline to 30 days after TAVR (based on sex-specific median % change in LVMi). The event rates were calculated with the use of Kaplan-Meier methods and compared with the use of the log-rank


