
Figure 4. Speed Fating: an adaptive signaling pathway can extract positional information without a spatial gradient.
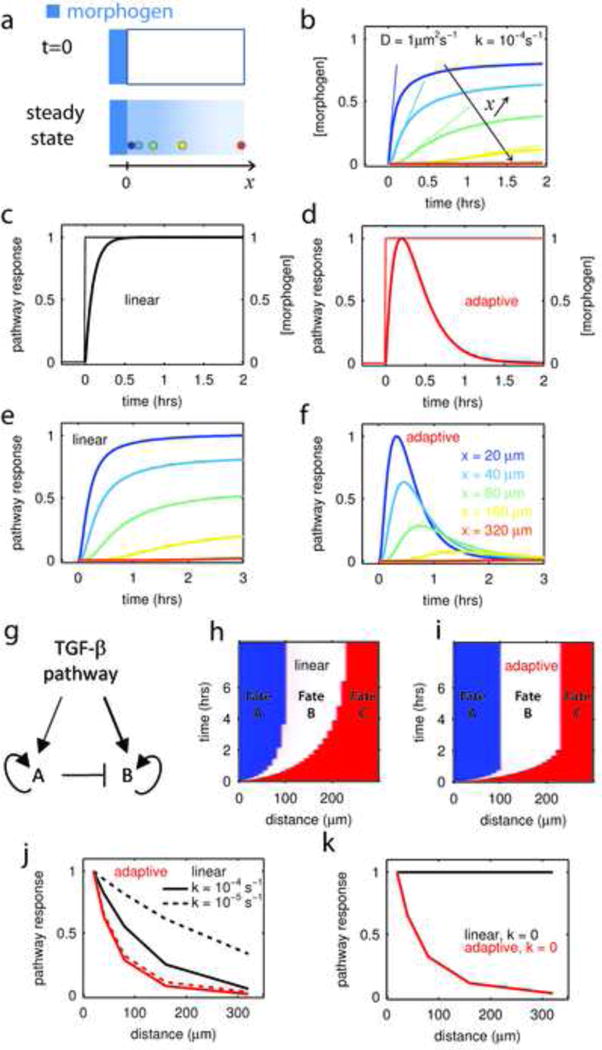
a-At t=0, a morphogen (in blue) is allowed to diffuse in a tissue from a constant source located in x=0 (upper panel). The diffusion constant is D and ligand decays at a rate k. In such conditions, the steady state profile of concentration is an exponential gradient with characteristic length (lower panel). Colored circles represent cells at various distances from the source.
b –The temporal profile of ligand concentration, calculated at various distances from the source (x) and for ligand parameters, D, k, characteristic for embryonic development (Muller et al., 2012), show that both the steady state concentration and the speed at which this steady state is reached depend on the distance to the source. Color code in (a) or (f)
c–d Comparison of a linear pathway (c) and an adaptive pathway (d) responding to a ligand step as in (b);. For the “linear” pathway, the response (y) to ligand input (I) is given by the differential equation y˙ = I − cy, where c sets the time scale of response. The adaptive pathway is defined by the system y˙ = I − cy − 0.25c2.x; x˙ = y (see supplementary methods) where again c sets the response time and x is a feedbcak. The reaction time of both pathways is defined to be identical (c = 10h−1) and both of them have an amplitude of response that is linear with the ligand concentration. As a consequence they would show an identical dose-response curve to ligand presented as a step.
e - Response of the linear pathway (c) to the different ligand profiles presented in (b). The linear pathway can extract positional information, i.e. the observed response varies as a function of the distance from the morphogen source. Color code for distance follows panel (f).
f - Response of the adaptive pathway (d) to the different ligand profiles presented in (b) depends on the distance to the morphogen source. However the differentiation decision, defined by the time of the response maximum in the adaptive case or when the response saturates for the linear pathway, can be faster in the adaptive system.
g – Minimal gene regulatory network for fate decision between two fates (A and B) induced downstream of TGF-β pathway activity. Factor A is activated at lower TGF-β levels than B, as depicted by the thickness of the arrows.
h–i– Establishment of a French flag pattern in function of time for a linear (h) or adaptive (i) pathway. Fate A (blue) and B (white) are induced downstream of TGF-β signaling and A represses B as in the GRN described in (g). Fate C (red) represents the default fate (both A and B are off). When an adaptive pathway is used, the final pattern is reach 3 times faster.
j – Comparison of how the two pathways extract positional information from a spreading gradient of morphogen. The adaptive pathway is more efficient at patterning since its distance-response curve is much sharper. Furthermore, response-distance function of the adaptive system is insensitive to changes in morphogen properties (dotted lines, 10 fold decrease in decay rate) while the linear pathway is.