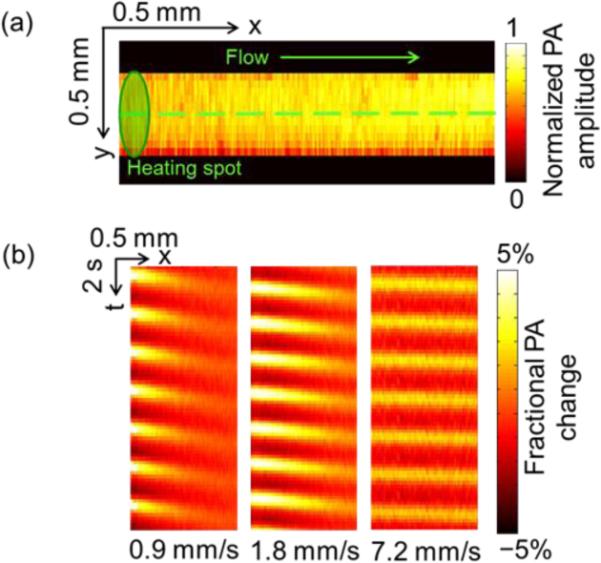
Fig. 2.

PA flow images of ink solution in a tube with a modulated heating frequency of 0.5 Hz. (a) Maximum-amplitude projection (MAP) image of a silicone tube fille d with red ink solution. Dashed line: B-scan range. (b) Representative space-time images of a tube along the dashed line in (a) at different flow speeds.
