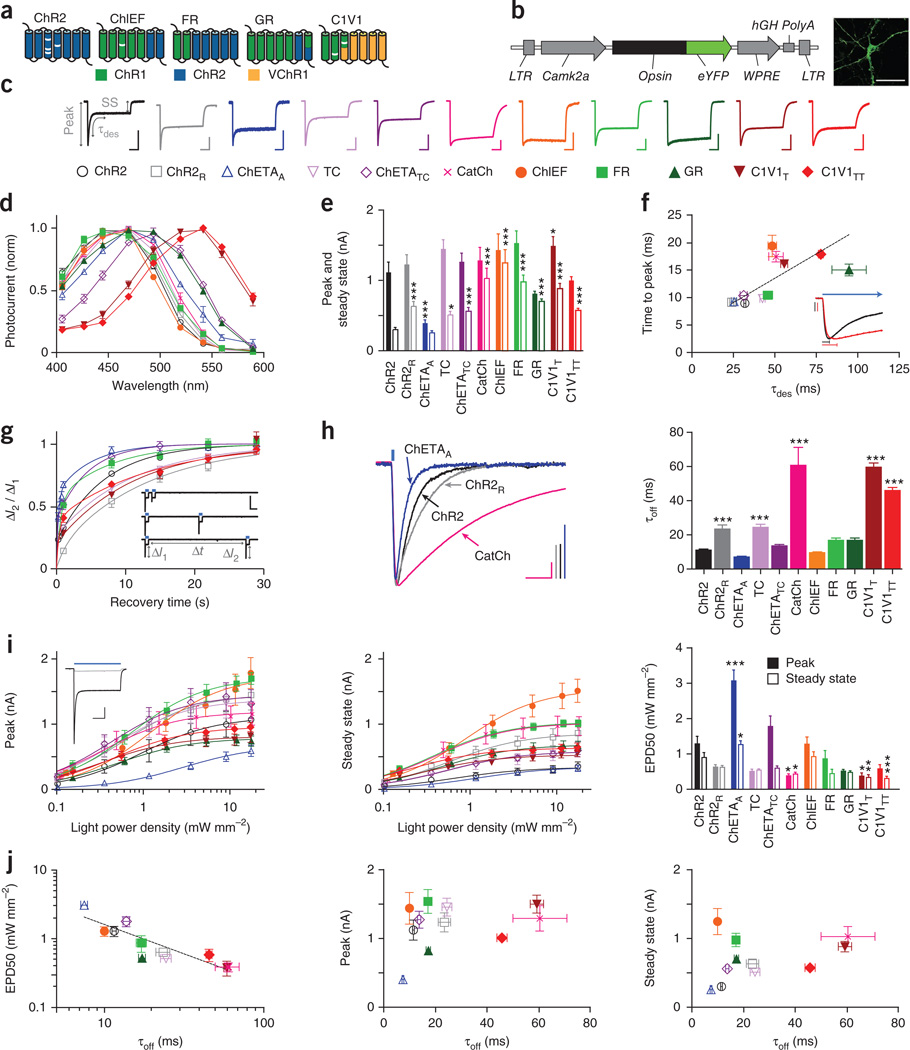
Figure 1.
Properties of depolarizing optogenetic tools. (a) Depolarizing tool classes. White bars indicate mutations. (b) Construct design and representative image for in vitro characterization. Scale bar, 50 µm. (c) Normalized representative photocurrents. Scale bars, 400 pA, 200 ms. Horizontal scale bar applies to all traces. Color and shape legend applies throughout the figure. (d) Action spectra (n = 5–11). (e) Peak (filled bars) and steady-state (hollow bars) photocurrents to 1 s light (n = 8–27). (f) Time to peak (n = 8–27) versus τdes (n = 8–50). Traces show normalized representative ChR2 (black) and C1V1TT (red) onset photocurrents. Vertical scale bars represent 200 pA, bars indicate time to peak, and blue arrow indicates ongoing light pulse. (g) Recovery from desensitization (n = 5–20). Vertical and horizontal scale bars represent 1 nA and 2 s. (h) Normalized representative traces and summary plots of τoff (n = 8–53). Scale bars, 200 pA and 25 ms. (i) Peak and steady-state photocurrents across light intensities. Inset, representative ChR2 photocurrents at low (light gray) versus high (dark gray) light intensity. Scale bars, 250 pA and 250 ms. EPD50 for peak (filled bars) and steady state (hollow bars) (n = 5–15). (j) τoff versus EPD50 and peak and steady-state photocurrents. All population data are plotted as mean ± s.e.m. *P < 0.05, **P < 0.01 and *** P < 0.001. Unless otherwise indicated, C1V1T and C1V1TT were activated with 560-nm light, and all other tools were activated with 470-nm light at ∼5 mW mm−2.

