Figure 2.
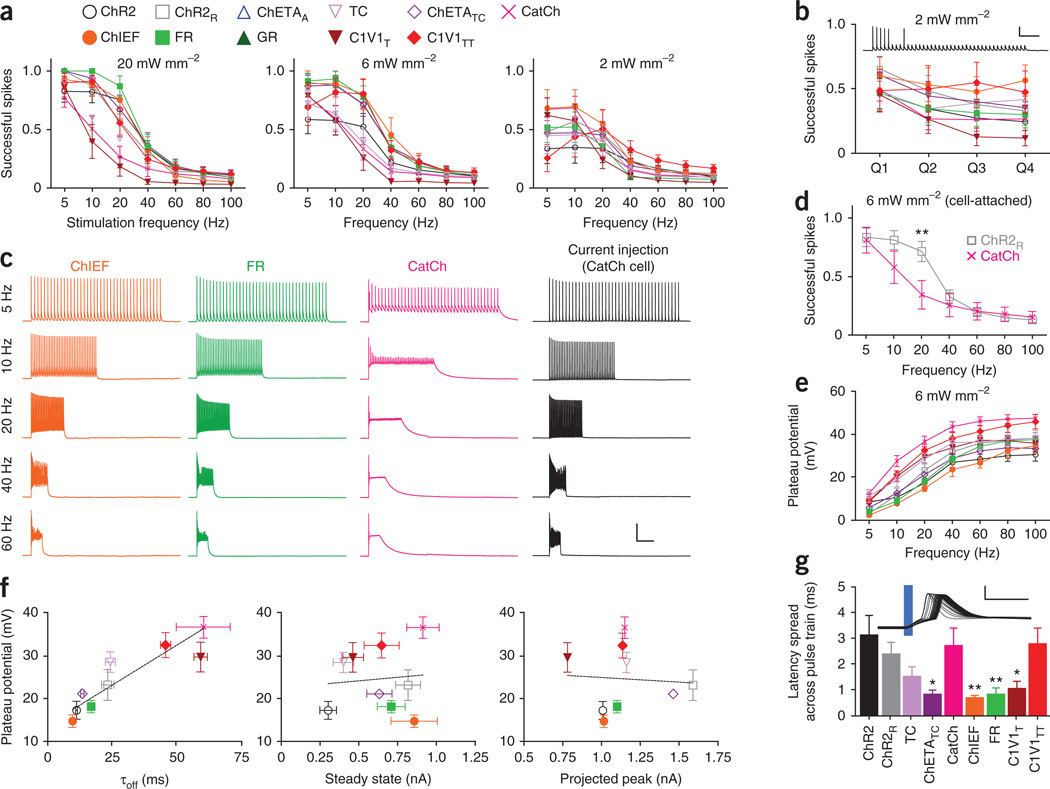
Performance of depolarizing tools. (a) Proportion of successfully evoked spikes (of 40 pulses; 5–100 Hz) at different light intensities (n = 8–18). Colors and shapes apply throughout the figure. (b) Temporal stationarity at 20 Hz, 2 mW mm−2(n = 8–18), based on the proportion of successful spikes in each quartile of pulses. Vertical and horizontal scale bars represent 40 mV and 1 s, respectively. (c) Representative evoked spiking across stimulation frequencies for ChIEF, FR and CatCh with closely matched ∼1.5 nA steady-state photocurrents at 6 mW mm−2. Vertical and horizontal scale bars represent 40 mV and 1 s, respectively. (d) Comparison of spiking performance between ChR2R (n = 19) and CatCh (n = 12) in cell-attached mode at 6 mW mm−2. (e) Plateau potential across pulse frequencies at 6 mW mm−2(n = 5–17). (f) Mean plateau potential for each opsin plotted against τoff, steady-state photocurrents and projected peak photocurrents. All values taken from the 6 mW mm−2 condition. (g) Latency spread across a pulse train, illustrated by representative traces of 40 consecutive ChR2 spikes in a train, aligned to the light pulse and overlaid. Vertical and horizontal scale bars represent 40 mV and 10 ms, respectively. All population data are plotted as mean ± s.e.m. *P < 0.05 and **P < 0.01. C1V1T and C1V1TT were activated with 560-nm light, and all other opsins were activated with 470-nm light.

