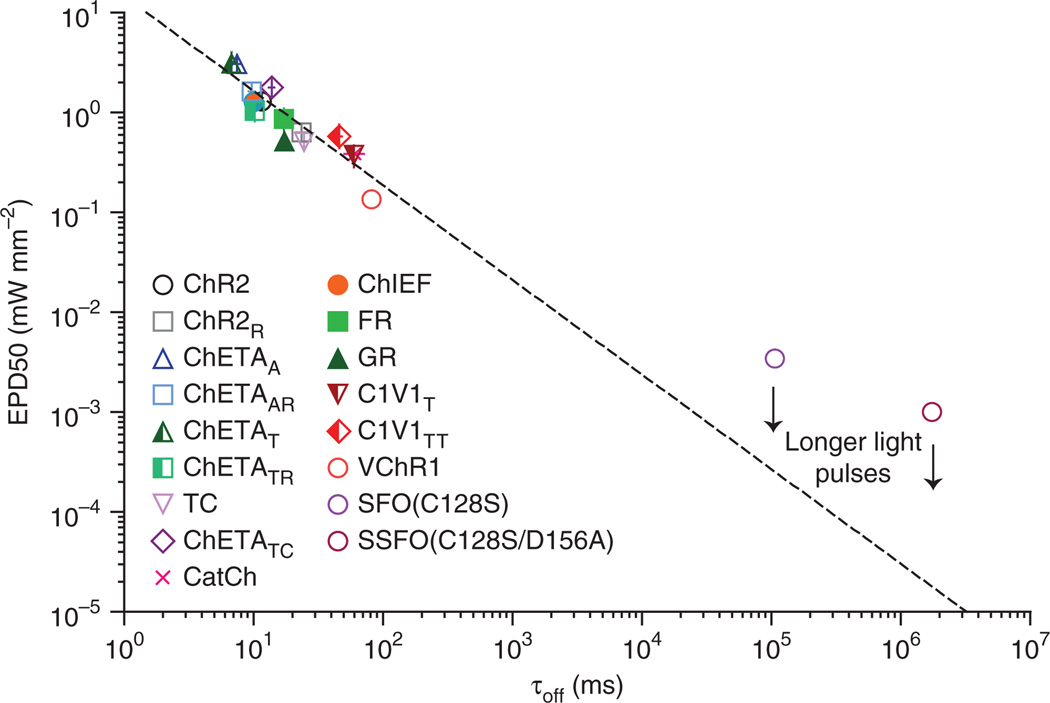
Figure 4.
Relationship between off kinetics and light sensitivity of optogenetic tools. Summary plot (on a log-log scale) of the relationship between τoff versus EPD50 for all depolarizing tools from Figures 1 and 3, plus VChR1, SFO(C128S) and SSFO(C128S/D156A). Dashed line represents best fit regression with R2 = 0.83; Spearman correlation coefficient R = −0.93, P < 0.001. Values for SFO and SSFO were estimated from previous publications11,15 and did not contribute to the regression or correlation calculations.

