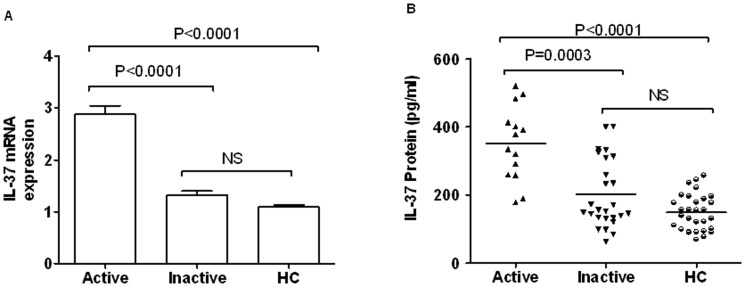
Figure 3. mRNA and protein levels of IL-37 in active and inactive GD as well as HC.
According to the levels of TSH and FT4, the study GD patients were divided into disease activity (n = 14) and inactive (n = 26) groups. (A) Serum IL-37 protein levels were detected by ELISA in active and inactive GD patients as well as HCs (n = 30). Bars show the expression levels of IL-37 in different groups (mean ± SEM). (B) Levels of IL-37 mRNA in PBMCs from active (n = 14) and inactive (n = 26) GD patients as well as HCs (n = 30) were measured by RT-PCR. Each symbol represents an individual inactive, active patient or healthy control. Horizontal lines indicate median values. Mann-Whitney U-test and associated P values are indicated.

