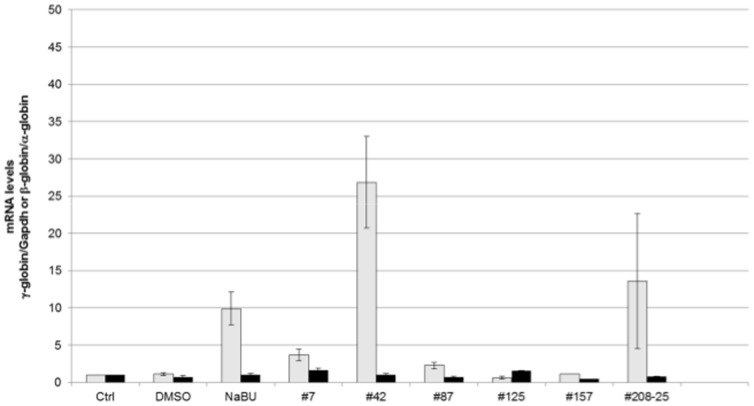
Figure 4. γ-globin and β-globin mRNA levels in compound-treated CID-dependent wild-type β-YAC mouse bone marrow cells.
qRT-PCR was performed as described in Materials and Methods. Fold change in mRNA level is shown on the y-axis; sample names are shown on the x-axis. Ctrl, untreated cells; DMSO, cells treated with DMSO only; NaB, 2 mM sodium butyrate; #7, 50 µM; #42, 15 µM, #87; 100 µM; #125, 30 µM; #157, 100 µM; #208-25, 25 µM. Gray bars, γ-globin mRNA expression; black bars, β-globin mRNA expression. Data shown are the results of two-three separate experiments, with each sample duplicated within an experiment. P≤0.01 for NaB and compound # 42; P≤0.05 for compounds #42 and #208.

