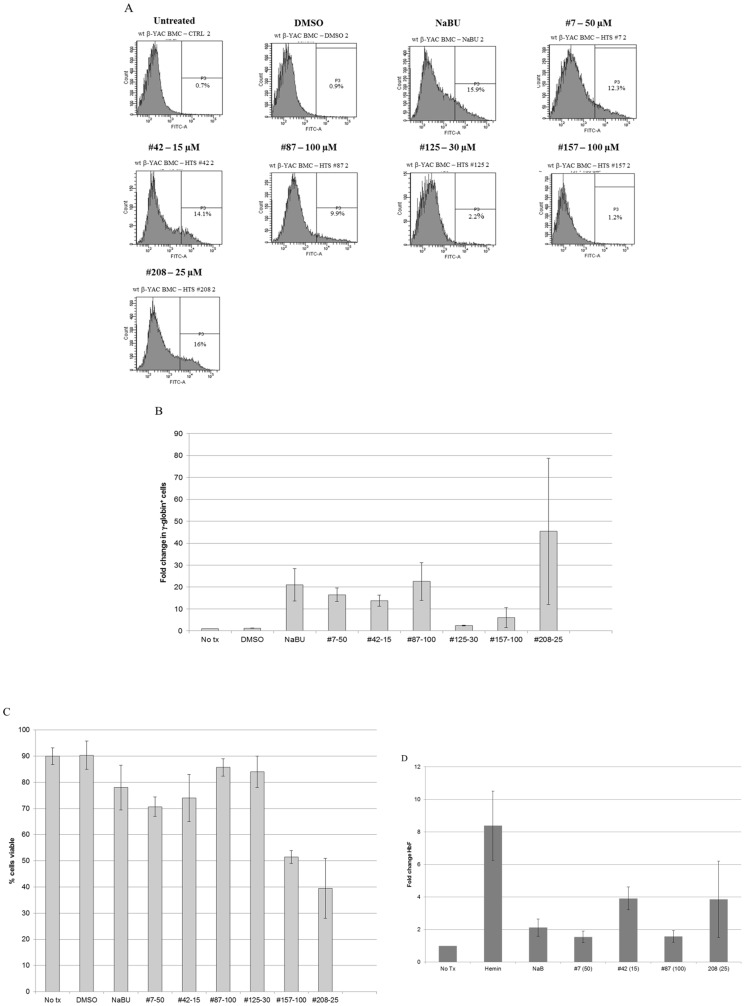
Figure 5. Induction of HbF by lead compounds in CID-dependent mouse BMCs.
Panel A) FACS analysis of HbF levels in compound-treated CID-dependent wild-type β-YAC mouse bone marrow cells. The protocol was carried out as described in Materials and Methods using anti-human HbF FITC-conjugated antibody. Samples are labeled as described in the legend to Figure 4, but compound concentration follows the compound number. Representative data from one experiment is shown here, but the experiment was replicated two to three times for each sample with similar results (summarized in Panels B and C). Panels B-C) Summary of FACS analysis of HbF levels in compound-treated CID-dependent wild-type β-YAC mouse bone marrow cells. Panel B) fold change in γ-globin (FITC)+ cells. Panel C) percent viable cells. Bars show mean and standard error of the mean in control and compound-treated cells for each panel. Panel D) HbF induction measured by ELISA in compound-treated CID-dependent wild-type β-YAC mouse bone marrow cells. The assay was carried out as described in Materials and Methods. Fold induction of HbF is shown on the y-axis; cell treatment and concentration, where applicable, are shown on the x-axis. Data represent the mean and standard error of the mean from four experiments with duplicate samples within each experiment.

