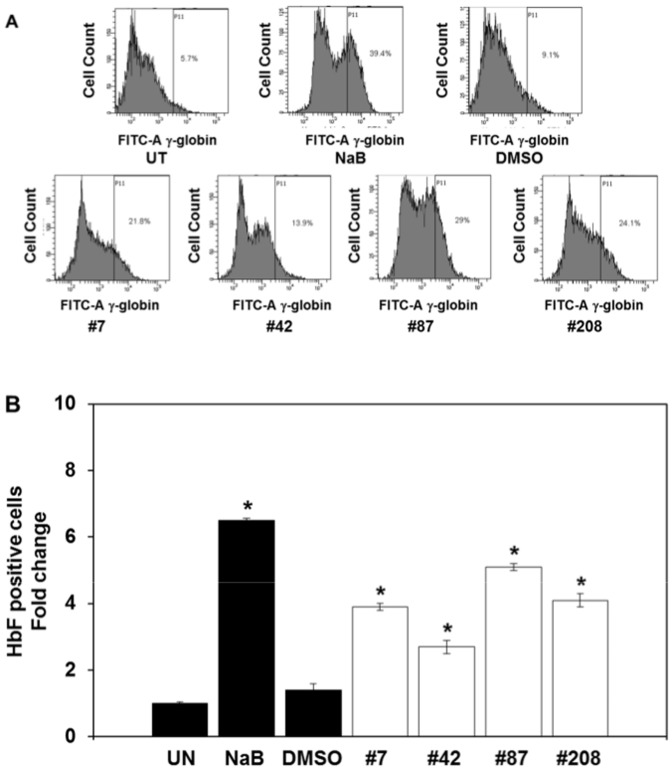
Figure 7. The lead compounds induce HbF expression in human primary erythroid cells.
FACS analysis was performed with erythroid progenitors treated for 48 hours with each of the four lead chemical compounds. The protocol was carried out as described in Materials and Methods using anti-human HbF FITC-conjugated antibody. Panel A) Representative FACS tracings are shown; experiments were replicated three times for each compound with similar results. Panel B) Based on the FACS data the % HbF-positive cells (FITC-A) was calculated for the different treatment conditions. Shown in the graph is the fold change in HbF-positive cells. Data are shown as the mean and standard error of the mean in control and compound-treated cells for each sample. *; P<0.01.

