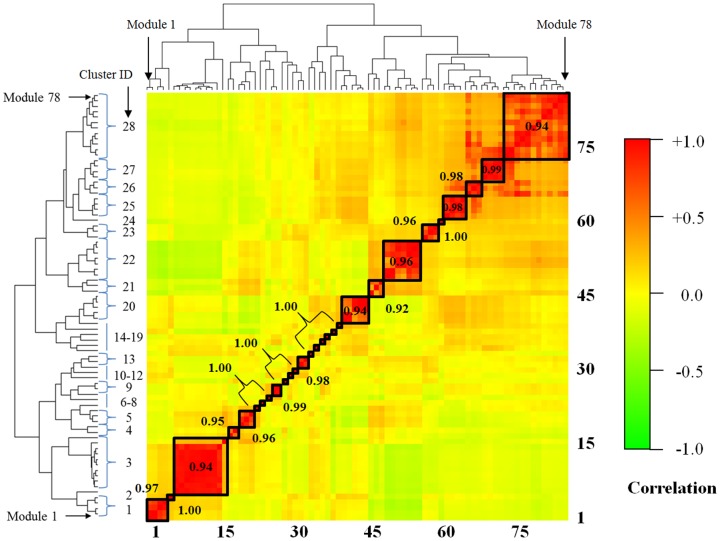
Figure 4. Clustering of the iterative signature algorithm (ISA) modules.
By construction, the modules represent groups of genes co-expressed across a subset of the conditions, and they may share genes. The clustering gauges the independence of the modules and groups some modules together. A dendrogram of the clustering is shown at right, giving the module membership 1–78 of each of the 28 module clusters. The Pearson correlation is the average intra-cluster correlation between modules in the same cluster.

