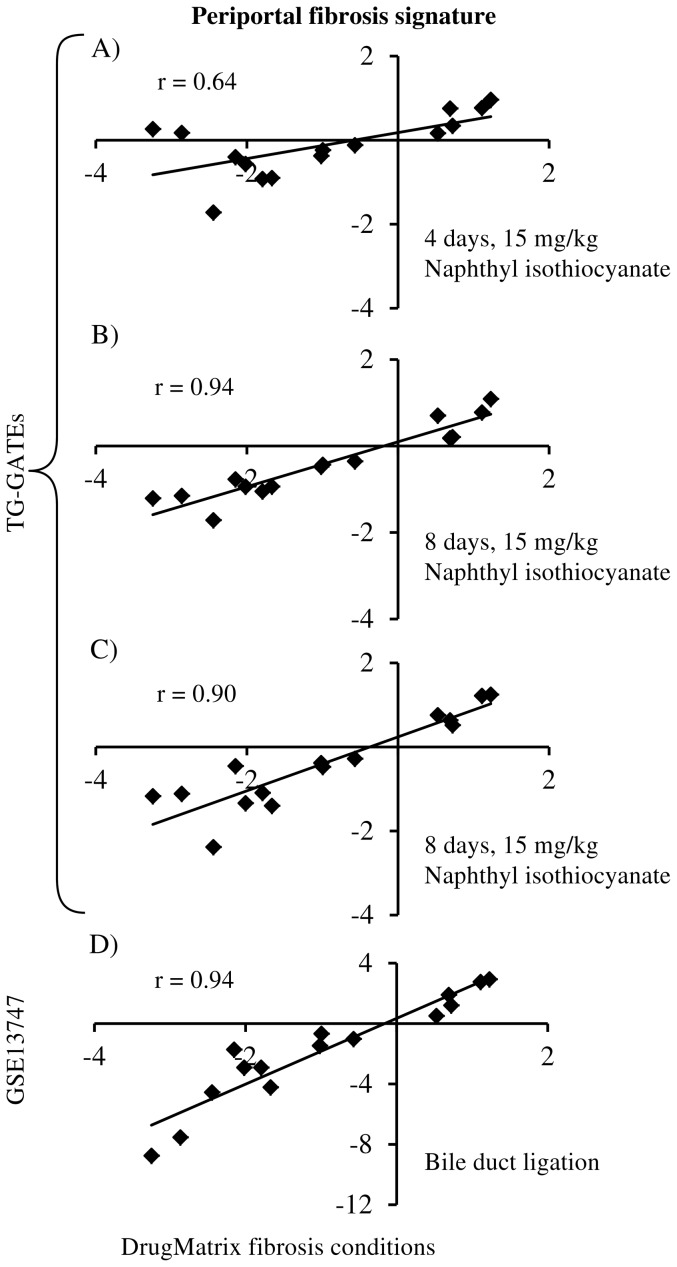
Figure 10. Validation of external datasets.
Scatter plots show the correlation of the log-ratios between DrugMatrix data and external datasets for the periportal fibrosis gene signature. Comparison of the log-ratios in DrugMatrix periportal fibrosis conditions with A) 15 mg/kg of naphthyl isothiocyanate at four days of exposure obtained from the Toxicogenomics Project-Genome Assisted Toxicity Evaluation System (TG-GATEs), B) 15 mg/kg of naphthyl isothiocyanate at eight days of exposure obtained from TG-GATEs, C) 15 mg/kg of naphthyl isothiocyanate at 15 days of exposure obtained from TG-GATEs, and D) liver fibrosis produced by bile duct ligation obtained from GSE13747.

