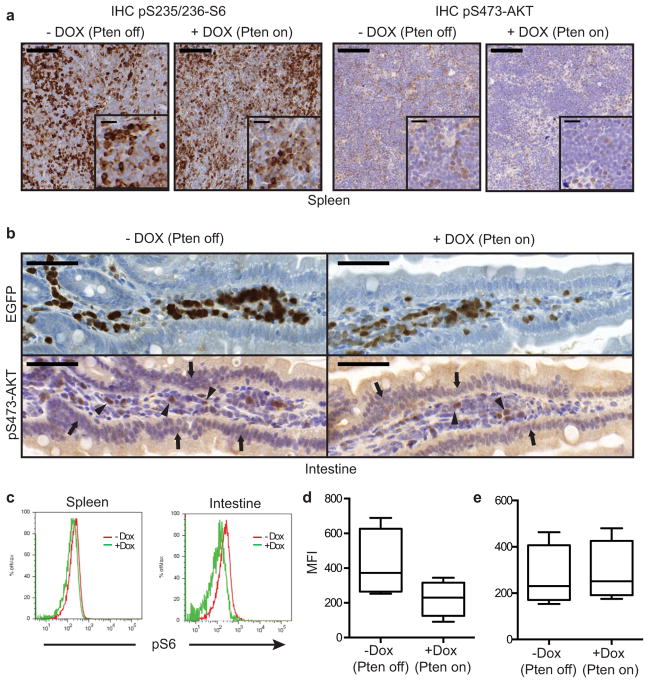
Extended Data Figure 8. Akt and S6 protein phosphorylation is affected by PTEN reactivation in the intestine.
a, Immunohistochemical (IHC) staining for phospho-S6 (pS235/236-S6) and phospho-AKT (pS473AKT) of spleen sections from Rag1−/− mice transplanted with Vav-tTA;shPten tumor cells from primary mice and either treated with Dox or left untreated two days after treatment begin (n=3 per group). Scale bars are 100 μm, 20 μm for insets. Representative images are shown. b, IHC staining for pS473-AKT (bottom) in the intestine, showing very low pAKT signal in the intestinal epithelial cells independent of Dox treatment status (arrows; bottom left and right panels), conversely strong staining for pAKT was detected in some of the infiltrating tumor cells (arrow heads). The signal was reduced concomitantly with the overall reduction of the Pten-shRNA linked GFP signal (top) after 36 h of Dox treatment (+ Dox; right panels). c, Representative histogram of flow cytometric analysis for intracellular pS6 signal in CD4+ cells isolated from spleen and intestine of Rag1−/− mice transplanted with shPten tumor cells and either treated with Dox for 5 days or left untreated. d, Flow cytometric quantification of pS6 signal in CD4+ cells isolated from the intestine and e, spleens of Rag1−/− mice transplanted with primary shPten tumors and treated ±Dox for 5 days (n=4 for each condition, P<0.04 for the intestine and n.s. for the spleen by paired t-test). MFI: mean fluorescent intensity.

