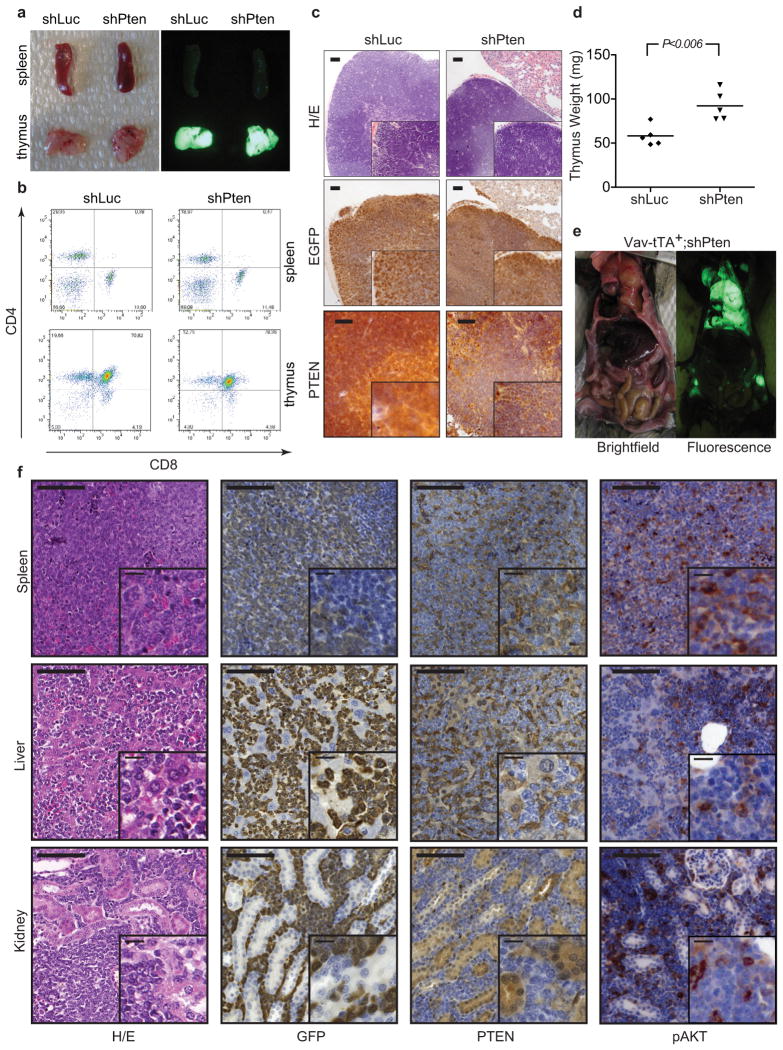
Extended Data Figure 2. Vav-tTA;shPten transgenic mice with targeted shPten expression in the hematopoietic lineage display thymic hyperplasia by 6 weeks, and a subset develops thymic tumors infiltrating multiple peripheral organs.
a, Brightfield (left) and fluorescence (right) images of spleen and thymus from Vav-tTA;shLuc (control) and Vav-tTA;shPten double-transgenic mice at 5 weeks. b, FACS analysis of spleen and thymus single cell suspensions from Vav-tTA;shLuc/shPten mice for CD4/CD8 expression. c, Immunohistochemical (IHC) analysis of thymic tissue from 6 week old Vav-tTA;shLuc and Vav-tTA;shPten mice. Sections were stained with haematoxylin/eosin (H/E), anti-GFP or anti-PTEN antibodies, showing heterogeneous GFP staining and correspondingly variable PTEN knockdown. Scale bars are 200 μm for H/E and GFP, and 100 μm for PTEN. The insets are 2× magnifications. d, Thymus weight of 6-week old Vav-tTA;shLuc and Vav-tTA;shPten mice (n=5 for both groups, P<0.006 by t-test). e, Brightfield and GFP-fluorescence images of a Vav-tTA;shPten mouse with tumors. f, IHC staining of spleen, liver, and kidney tissues from a Vav-tTA;shPten mouse with primary T-cell disease. Sections were stained for H/E, GFP, PTEN and phospho-AKT(S473) as indicated, showing heterogeneous staining due to variable tumor infiltration. Scale bars represent 100 μm (insets 25 μm).

