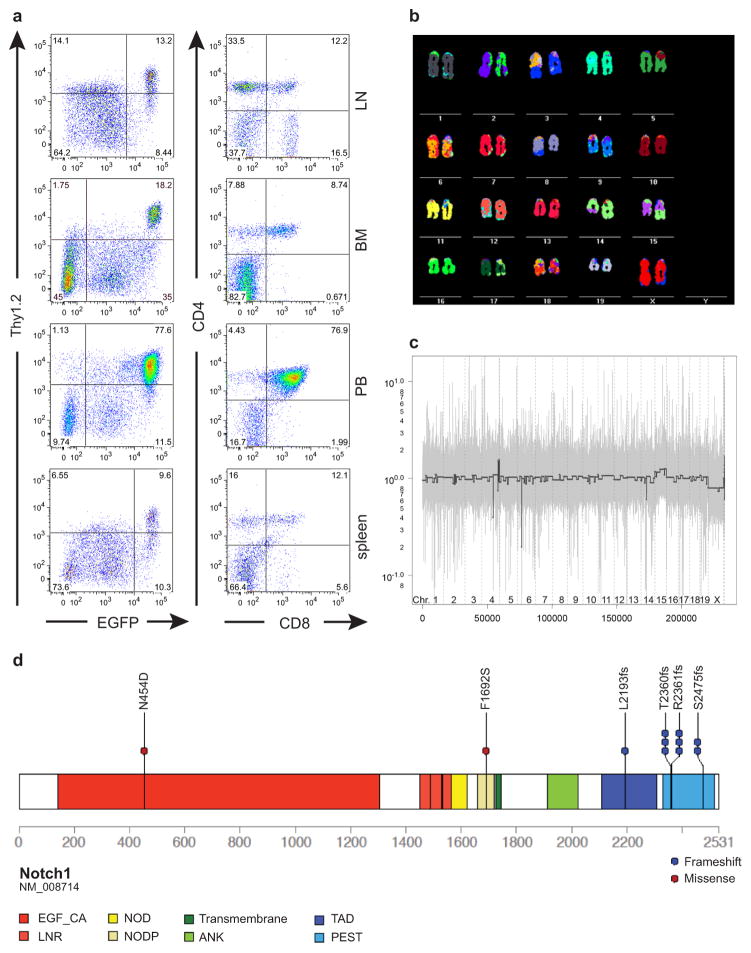
Extended Data Figure 3. Immunophenotype, chromosomal aberrations and Notch1 mutations observed in murine shPten tumors.
a, Flow cytometric analysis of organ infiltration by primary tumors in Vav-tTA;shPten.1522 transgenic mice. Single cell suspensions of indicated tissues were analyzed for EGFP, Thy1.2, CD4 and CD8 expression. LN: lymph node, BM: bone marrow, PB: peripheral blood. b, Spectral karyotyping analysis of a T-cell tumor arising in Vav-tTA;shPten.1522 mice, showing a t(14;15) translocation. c, Comparative genomic hybridization (CGH) analysis of a Vav-tTA;shPten.1522 leukemia. Genomic tumor DNA was analyzed on Affymetrix CGH SNP arrays and compared to normal skin tissue. X-axis indicates genomic coordinate and y-axis represents log2(tumor/germline). d, Schematic of the murine NOTCH1 protein generated using protein paint (http://explore.pediatriccancergenomeproject.org/proteinPainter), highlighting the different NOTCH1 protein domains and the mutations detected in the murine shPten T-ALL tumors.

