
Figure 2.
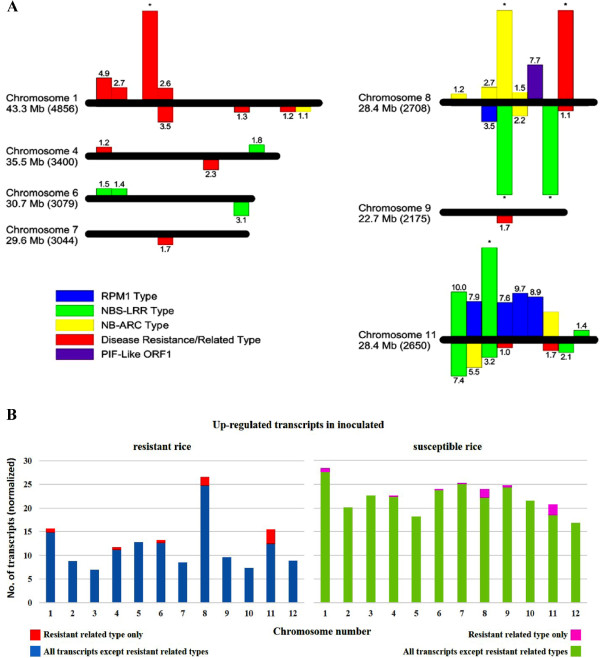
Chromosomal distribution of differentially expressed transcripts. (A) The chromosomal locations of resistance-related differentially expressed transcripts in R vs S comparisons are represented. Horizontal bars represent chromosomal axes and are proportional to their lengths while vertical bars represent differentially expressed transcripts. The location of the transcripts on the bars are relative to their chromosomal positions. Above the axes: up-regulated; below the axes: down-regulated; numbers on vertical bars represent log2foldchange while asterisks represent expression only in R (above axes) or S (below axes). The length and the predicted number of genes per chromosome (in parentheses) are indicated [59]. (B) The chromosomal locations of all up-regulated expressed transcripts in R and S are shown. To allow for comparison, the number of up-regulated transcripts was normalized by dividing the actual number by the predicted number of genes [59] and multiplying by 1000 to get a whole number CL 161 is R and CL 151 is S.