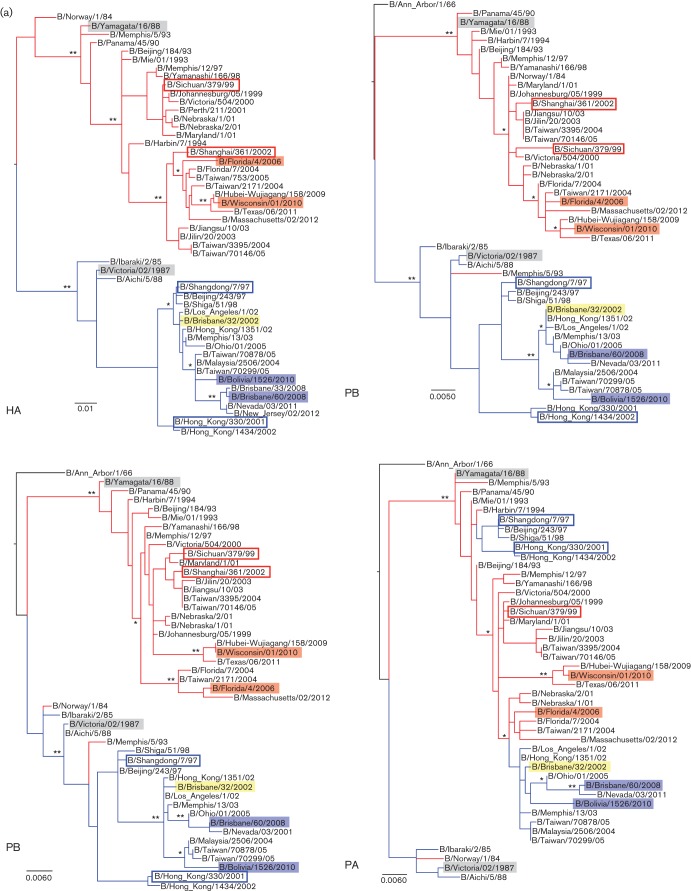
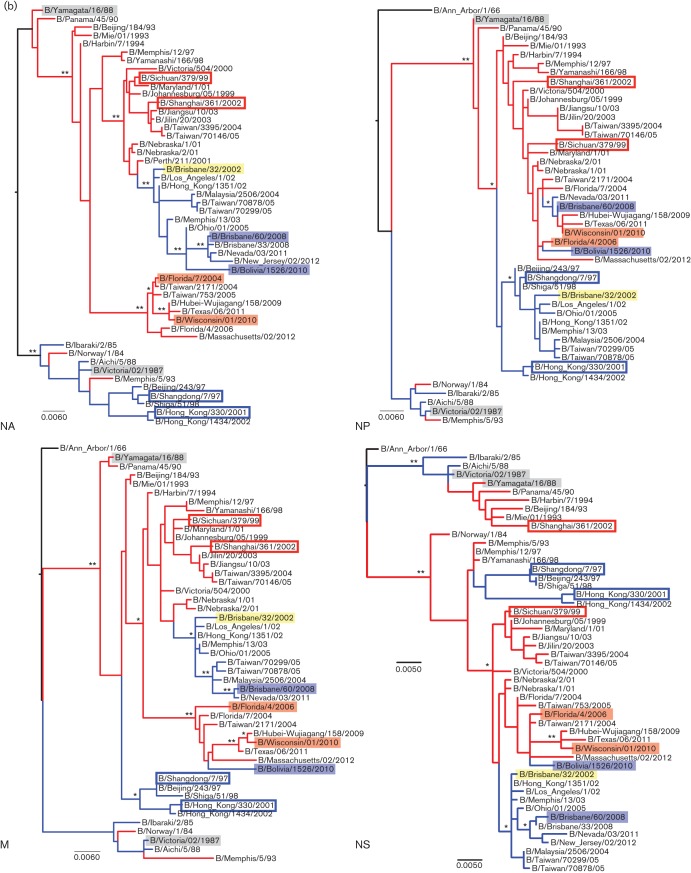
Fig. 5.
Evolutionary relationship of influenza B genes. The respective best fitting phylogenetic trees based on the nucleotide sequences of (a) PB2, PB1, PA and HA, and (b) NP, NA, M and NS segments of the viruses used this study were reconstructed by maximum-likelihood method with 1000 bootstrap replications using mega 5 software. Bars indicate the estimated frequency of nucleotide substitution per site. The blue and red shaded areas represent the B/Vic and B/Yam strains used in this study respectively. The blue and red branches annotate B/Vic and B/Yam lineage viruses according to the HA sequences respectively. The B/Vic and B/Yam prototype strains are highlighted in grey. The Bris/02 strain is highlighted in yellow. The blue and red open boxes indicate historical B/Vic and B/Yam vaccine strains specified in the text. ** and * annotate ≥95 % and ≥75 % confidence, respectively, that the branching leads to the clade classification of studied strains described in the text.


