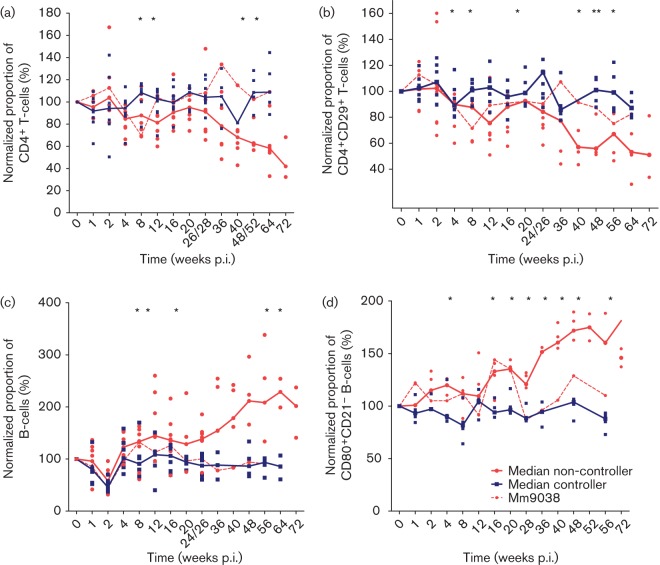
Fig. 2.
Lymphocyte subsets in SIVmac239ΔNU-infected rhesus macaques. Median values of controllers (blue) and non-controllers (red) are indicated by straight lines. Data of individual animals are shown by dots. Mm9038, which displays the phenotype of a viraemic controller, is shown by a dashed line. Asterisks mark significant differences between controllers and non-controllers (including Mm9038) calculated by the Mann–Whitney test (P<0.05). (a) Proportion of CD4+ T-cells normalized to mean of three values before infection. (b) Proportion of CD4+CD29+ T-cells normalized to mean of three values before infection. (c) Proportion of B-cells normalized to mean of three values before infection. (d) Proportion of CD80+CD21– B-cells normalized to mean of three values before infection.

