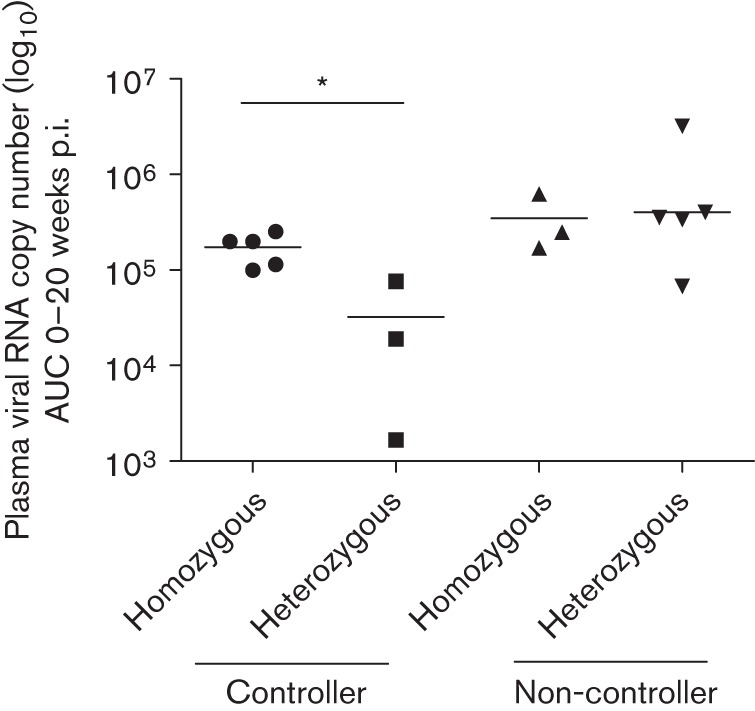
Fig. 5.

Plasma RNA copy number from 0 to 20 weeks p.i. depicted as area under curve (AUC) stratified against MHC class II DQB1-DRB haplotype homo- or heterozygosity in controllers and non-controllers. MHC DQB1-DRB homozygous controllers had a significantly higher viral load compared with heterozygous controllers (P = 0.036, Mann–Whitney test). Geometric means are shown by a horizontal line.
