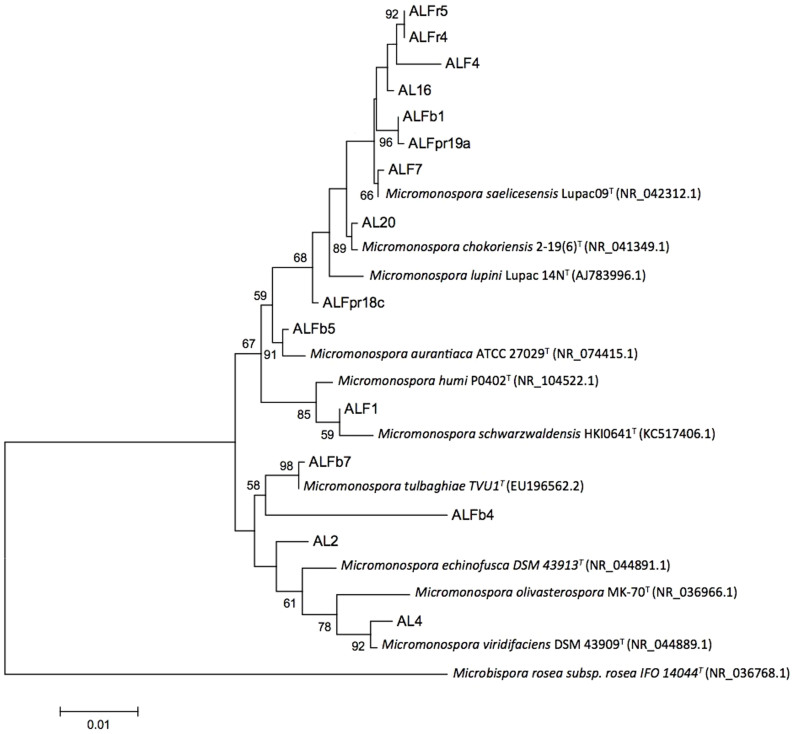
Figure 2. Maximum likelihood phylogenetic tree based on 16S rRNA gene sequences showing the relationship between the Micromonospora isolates and the closest recognized Micromonospora species.
Bar, 0.01 substitutions per nucleotide position. Bootstrap percentages (1000 replicates) above 50% are shown at nodes.

