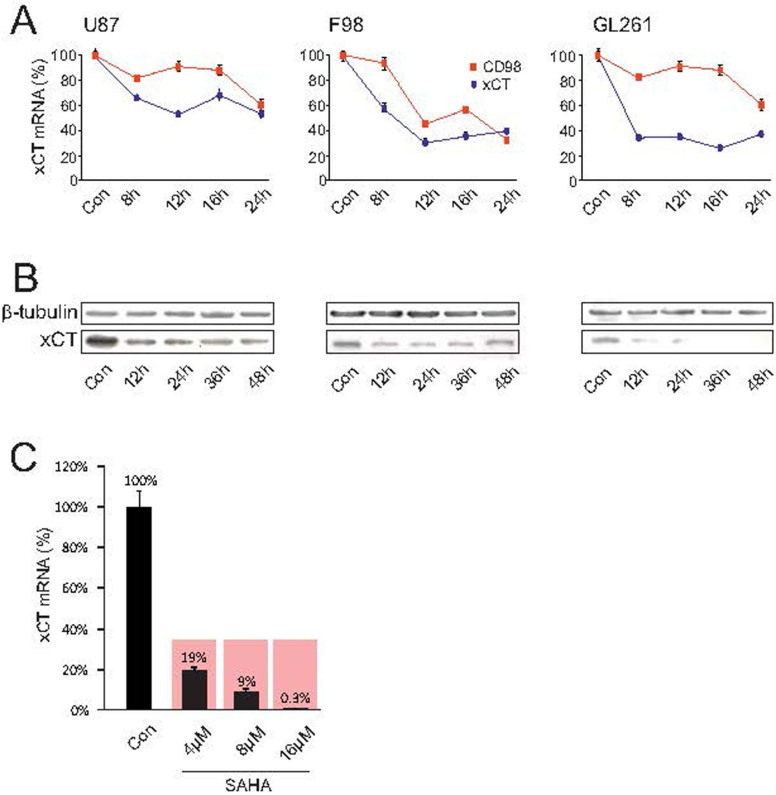
Figure 2. SAHA silences xCT expression and function.
(A), The human U87MG, rat F98 and mouse GL261 glioma cell lines were treated with 8 μM SAHA and xCT as well as CD98 expression were subsequently analyzed by real-time RT-PCR. A significant suppression of xCT was observed in all three established glioma cell lines. (B), xCT expression analysis by immunoblotting. Down-regulation of xCT protein was observed after treatment with 8 μM SAHA already 12 hours following treatment. Membranes were reprobed for β-tubulin expression to show that similar amounts of protein were loaded in each lane. The cropped blots are shown in the figure and the full-length blots are presented in supplementary figure 1. (C), SAHA inhibits xCT expression in human malignant glioma tissue. Glioblastoma tissue obtained from a GBM patient was cultivated and treated with 4 μM SAHA, leading to a significant reduction of xCT-expression. Statistical significance was calculated with the Student's t-test (mean ± sem, *P < 0.05, n = 3 per group).

