
Figure 3.
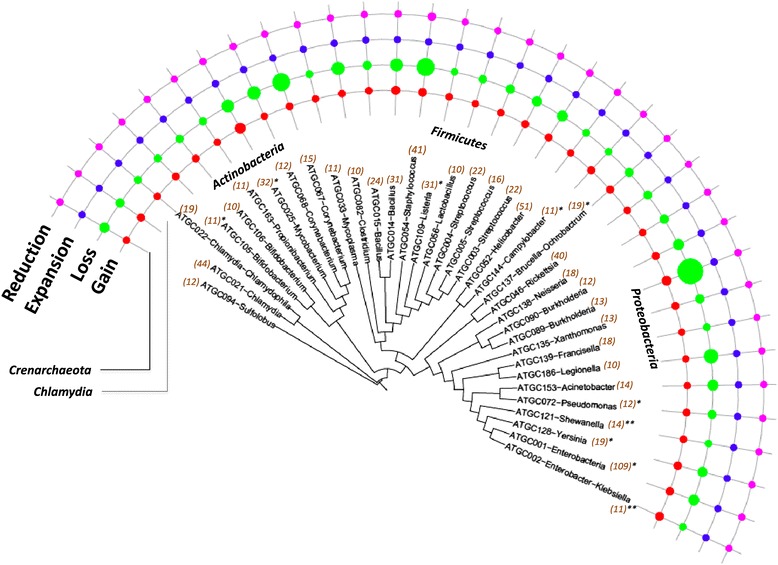
Distribution of the gain, loss, expansion and reduction rates over the evolutionary tree of prokaryotes. The tree is from MicrobesOnline [62]. The areas of the circles are proportional to the rates of the respective events to a logarithmic scale. The numbers in parenthesis indicate the number of species in the ATGC. The ATGCs with episodes of rapid gene gain are denoted with *(<10% of branches) or **(>10% of branches). ATGC, alignable tight genome cluster.