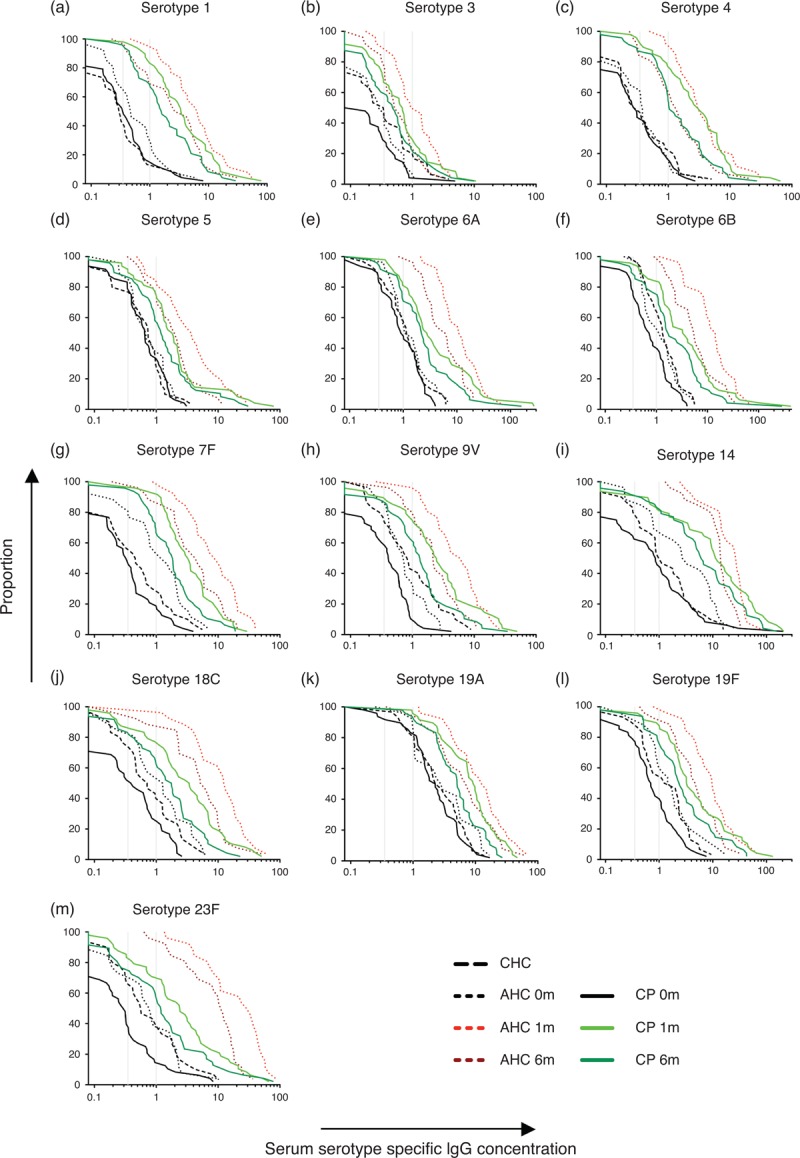
Fig. 2.
(a–m) Reverse cumulative distribution curves showing the proportion (%) of individuals above increasing concentrations of serotype-specific antibody for healthy children, young healthy adults and children with perinatally acquired HIV.

Baseline antibody concentration data are displayed in black. Post-immunization data for young healthy adults are shown in red and for HIV-infected children in green. Vertical grey lines indicate cut-off of 0.35 and 1 μg/ml. 0m, baseline; 1m/6m, 1 month/6 months after immunization; AHC, adult healthy control; CHC, child healthy control; CP, child patient; mcg, μg; S, serotype.
