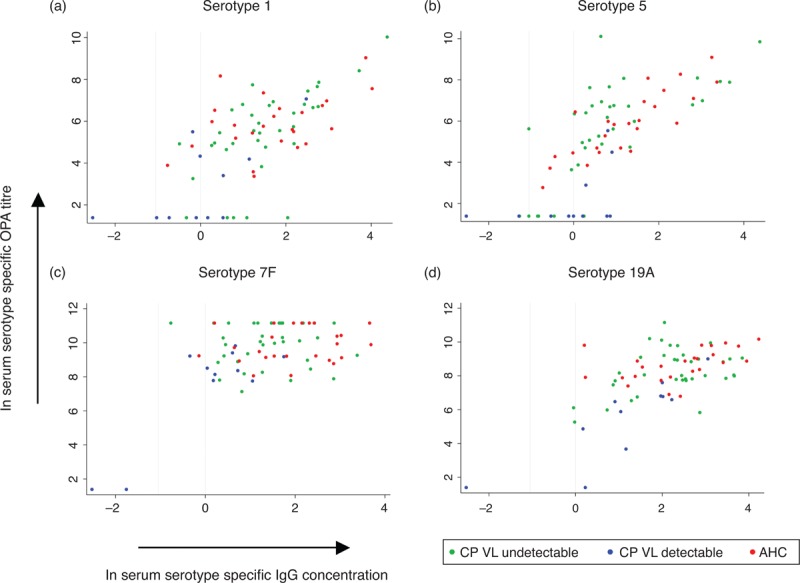
Fig. 3.
Scatter graphs showing log-transformed opsonophagocytic assay titres against log-transformed serotype-specific IgG for adult healthy controls and child patients 1 month after 13-valent pneumococcal conjugate vaccine.

Grey vertical lines indicate transformed value for the cut-offs of 0.35 and 1 μg/ml. 1.39 on the Y-axis corresponds to an OPA titre of 4. IgG concentration significantly correlated with OPA titre for all serotypes in both groups except 7F for AHC. Linear regression was used to test for association between log-transformed OPA and IgG concentration. Chi-square and Fisher's exact tests were used to compare proportions. Serotype 1: CP (P < 0.005, R2 = 0.51); AHC (P < 0.05, R2 = 0.16). Serotype 5: CP (P < 0.005, R2 = 0.48); AHC (P < 0.005, R2 = 0.70). Serotype 7F: CP (P < 0.005, R2 = 0.29); AHC (P = 0.4, R2 = 0.01). Serotype 19A: CP (P < 0.005, R2 = 0.35); AHC (P < 0.05, R2 = 0.18). A higher proportion of children with paHIV had OPA titres below 8 for serotypes 1 [AHC: 25/25 (100%) vs. CP: 36/47 (77%), P = 0.007] and 5 [AHC: 25/25 (100%) vs. CP: 32/47 (68%), P = 0.001], despite the majority having serotype-specific IgG concentrations greater than 0.35 μg/ml. AHC, adult healthy control; CP, child patient; VL undetectable, viral load below 50 copies/ml; VL detectable, viral load above 50 copies/ml.
